Monitoring the VO
All the VO resources are registered in the gCore Based Information System and they can be monitored through the gCube Monitoring System.
Following the VO installation and configuration, there are three type of resources of major interest to monitor, the so-called infrastructural resources. They are:
- gCube Hosting Node (gHN)
- Service
- Running Instance (RI)
In addition, also the Information Space can be monitored by keeping under surveillance the Collection and Metadata Collection resources that have been imported in the VO.
Different views of the Infrastructure Viewer expose a graphical representation of the state of these resources and offer to the VO Administrator the possibility to obtain a clear picture of the overall state of the Virtual Organization.
Monitoring the gHNs and RIs
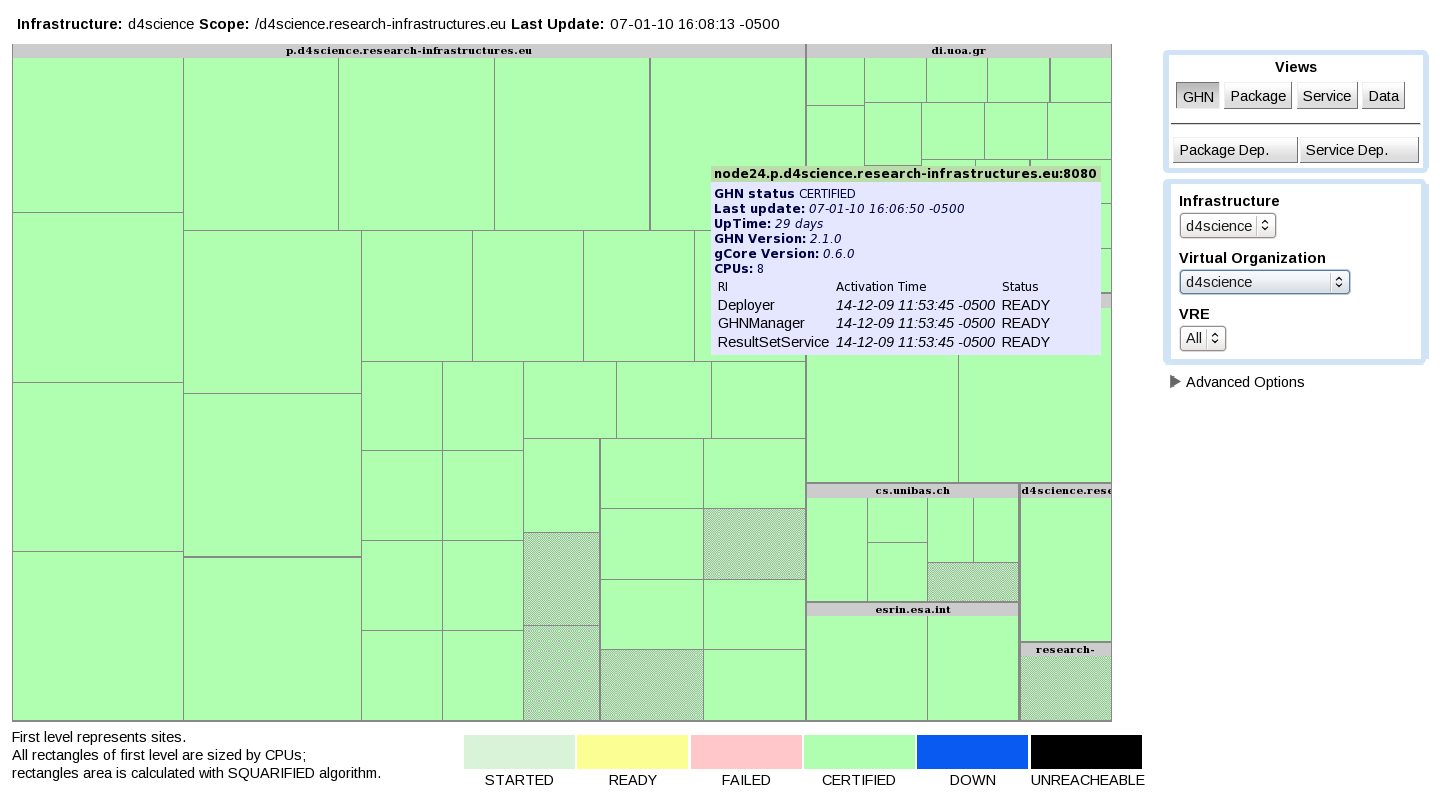
The GHN View allows to check the status of the gHNs and hosted RIs. If everything is OK, all the gHNs have to be in the CERTIFIED state and the RIs have to be in the READY state.
The following figure depicts a typical view of a VO where all the gHNs and RIs are OK (and displayed in green color):
All the gHN boxes are reported in green color and by passing the cursor over any of them, all the RIs hosted on that gHN are reported to be in a READY state.
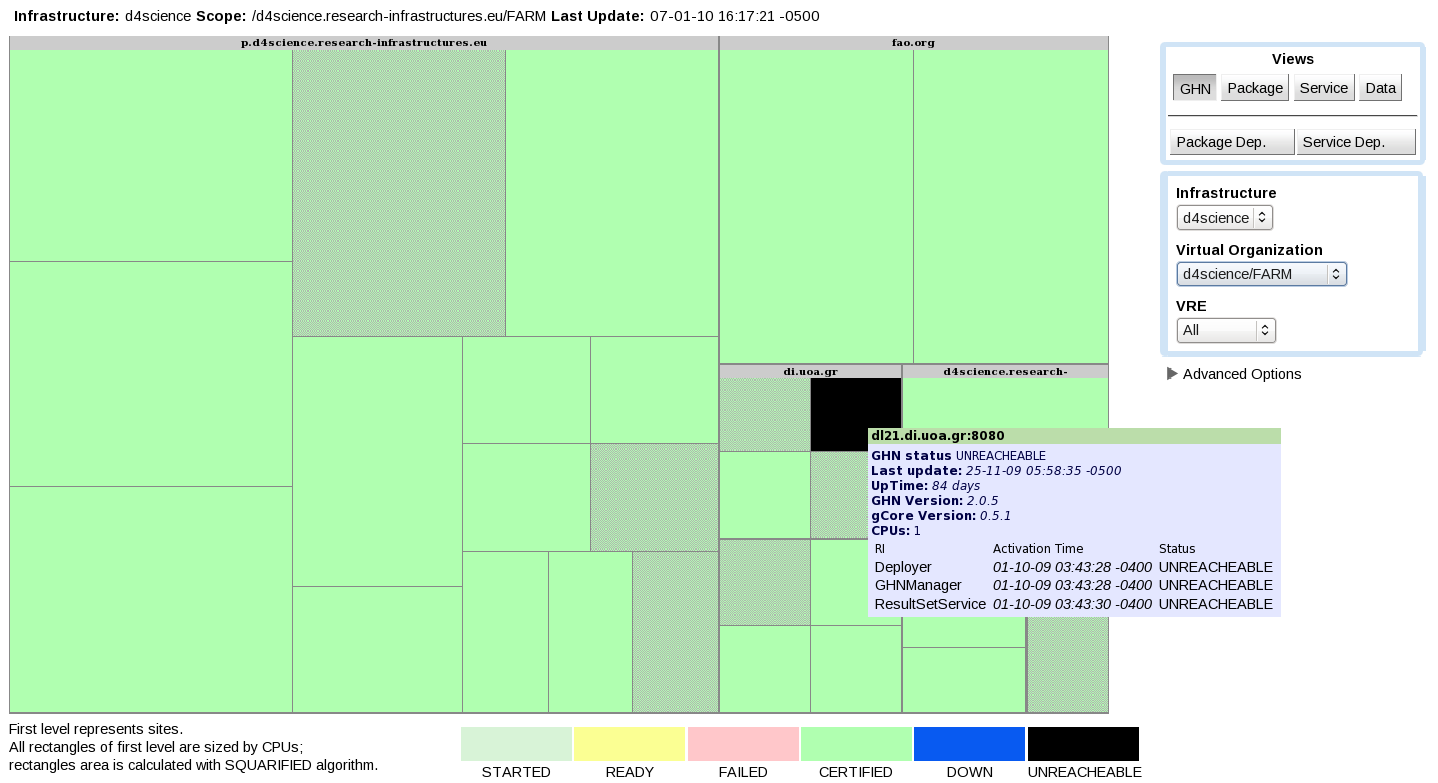
If something is wrong, e.g. a gHN is not started correctly or a RI is not working, the view reports these situations, like in the following picture:
Here a gHN is not currently reachable and this is brought to the attention of the VO Administrator to take corrective actions.
Monitoring the Services
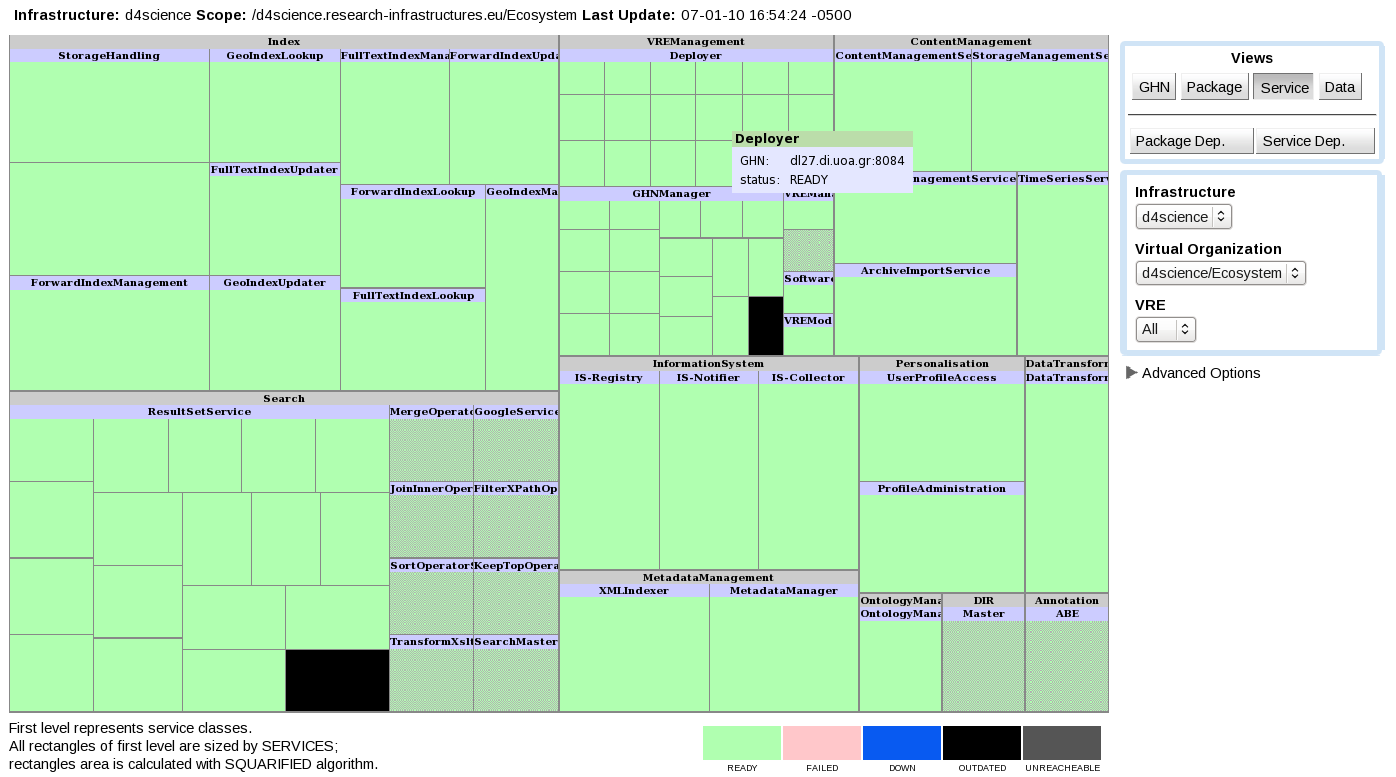
If the Software Repository has been populated correctly (see VO installation), a bunch of gCube services have been registered in the IS. The Service View allows to check wherever they are actually deployed, i.e. on which gHN(s) a RI of each service is deployed and activated, and the current status of each instance. The following picture shows an example of a Service View in a selected VO:
If all the instances are OK, there exists a green box for each instance grouped per service. If some of them are somehow not working properly, the related box has a different colour, depending on the reason (like in the example above, where two instances are in a black box).
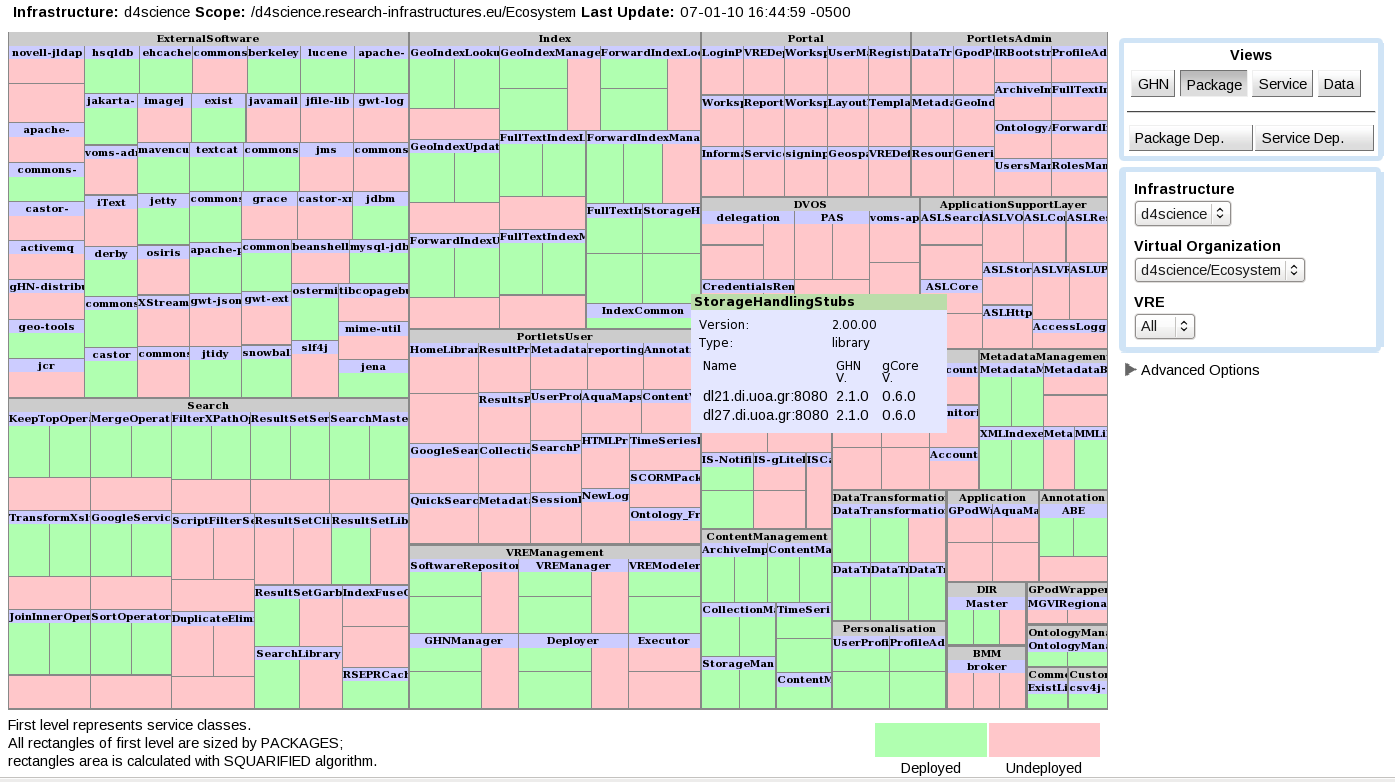
If the VO Administrator wants to have a more detailed understanding of what is currently deployed in the VO, the Package View offers a nice way to check which software packages have been registered in the VO and, eventually, where they are actually deployed.
This is an example of a Package View where part of the packages are deployed (green boxes), while others are just registered (pink boxes):
Monitoring the Data
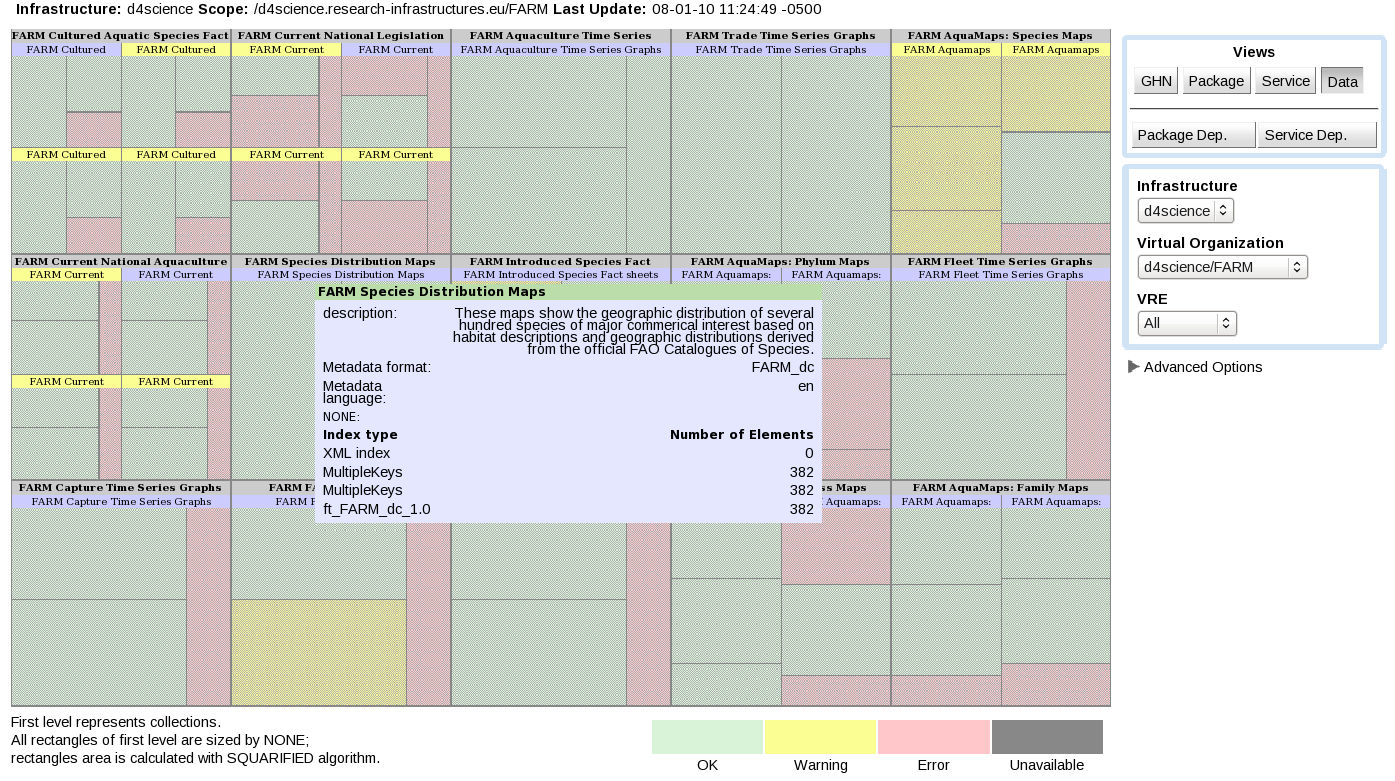
By monitoring the Collection and Metadata Collection resources, the VO Administrator is aware about the current content available in the VO. The Data View presents per each Collection registered in the VO:
- the status of the collection itself (e.g. if it has been fully indexed per each metadata), represented by the colour of the related box
- the available metadata formats
- the status of the related indexes per metadata
This is an example of a Data View where part of the Collections are OK (green boxes), while others report to have problem with the indexing activities (pink/yellow boxes):
