BTRT
Contents
Introduction
BTRT stands for Build and Test Report Tool and it is a web application developed expressly to provide access to statistics, logs and reports produced during Continuous Integration and Release/Maintenance cycles of gCube software. It is used by Release Managers, Subsystem Managers and Developers to quickly identify integration, deployment and functional defects in software being released.
Running instances of BTRT
http://eticsbuild2.research-infrastructures.eu/BuildReport/home/AllBuilds
http://eticsbuild3.research-infrastructures.eu/BuildReport/home/AllBuilds
BTRT in detail
BTRT application provide data (statistics, logs, reports) at three different abstraction levels: repository level, configuration level and build level. All data available in BTRT is hosted in one or more Build Repository. From this point of view, BTRT can be considerated an application that browse a Build Repository. Indeed BTRT is much more than this since it computes useful reports starting from "raw" data available in repositories. BTRT is structured in three levels (like data it provides): Repository, Configuration and Build Level. In next sections an in-depth explanation of each level is provided.
Repository Level
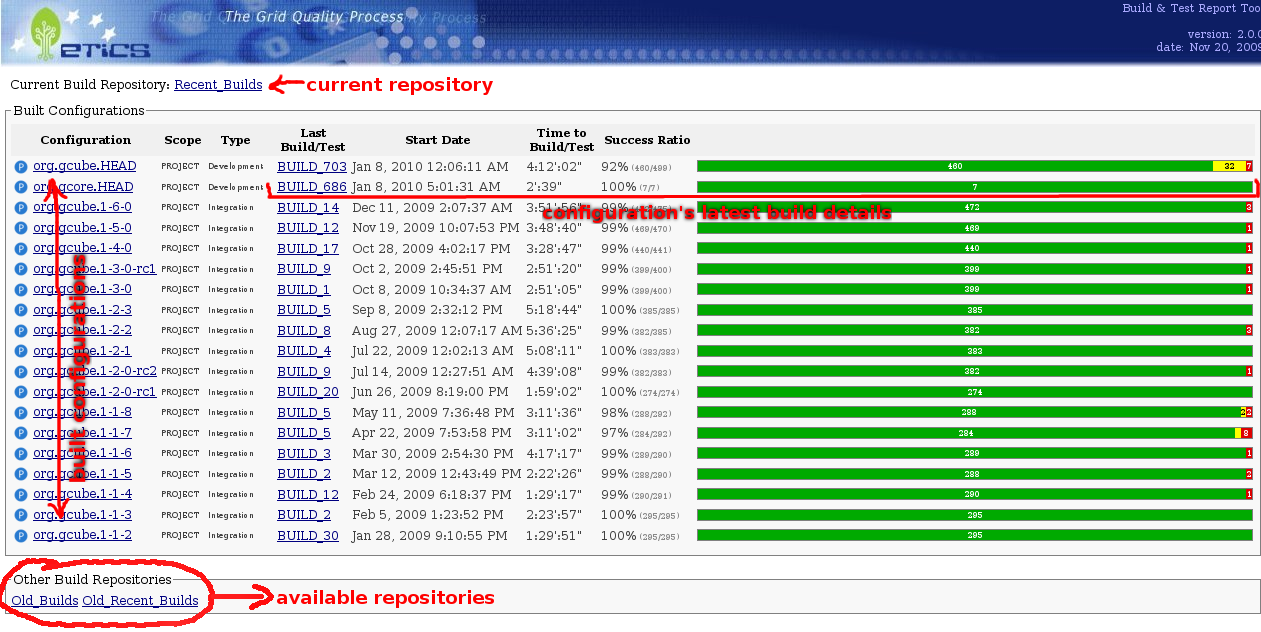
The entry point to BTRT application is the list_repository page that lists all built configurations available in the selected repository. BTRT has a default repository, but users can decide time by time the repository they wants to inspect.
Built-Configurations list provide, for each configuration, information about latest build executed for that configuration and its statistics (timing, compiling results).
Configuration Level
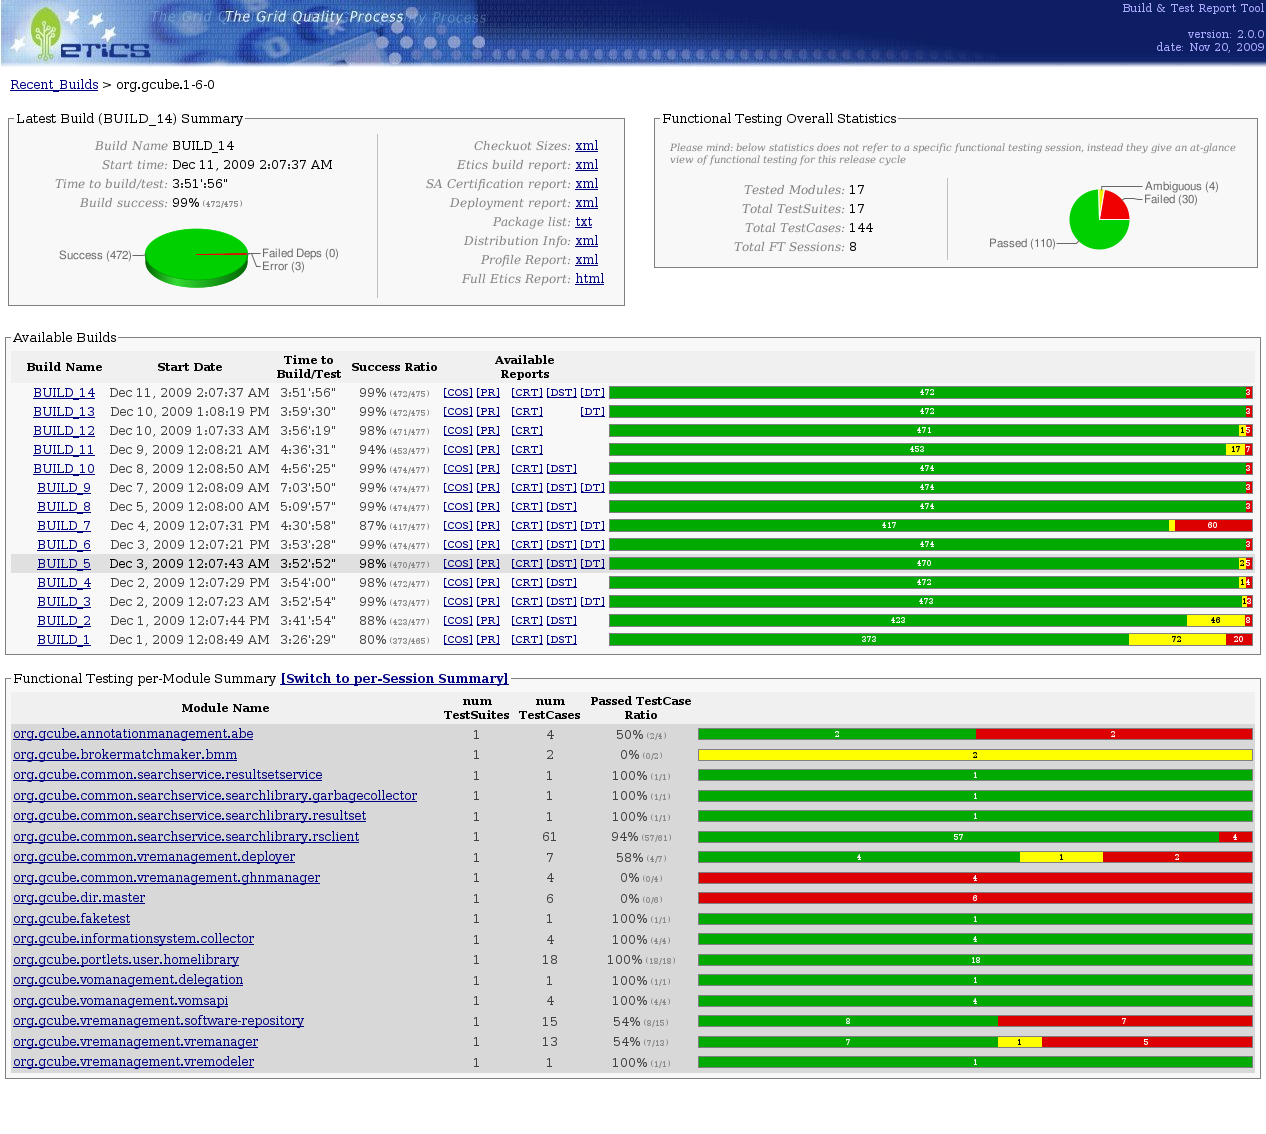
By clicking on one of configurations' name in BTRT homepage, the configuration_home will appear. This page is composed by four panels:
- Latest Build Summary: time statistics and reports links about latest build executed for the configuration
- Functional Testing Overall Statistics: an overview on Functional Testing status for the configuration
- Available Builds: The list of all builds executed for the configuration
- Functional Testing per-Module (per-Session) Summary: List of Functional Testing sessions executed against the configuration (see More on Functional Testing Reports section for further information)
Build Level
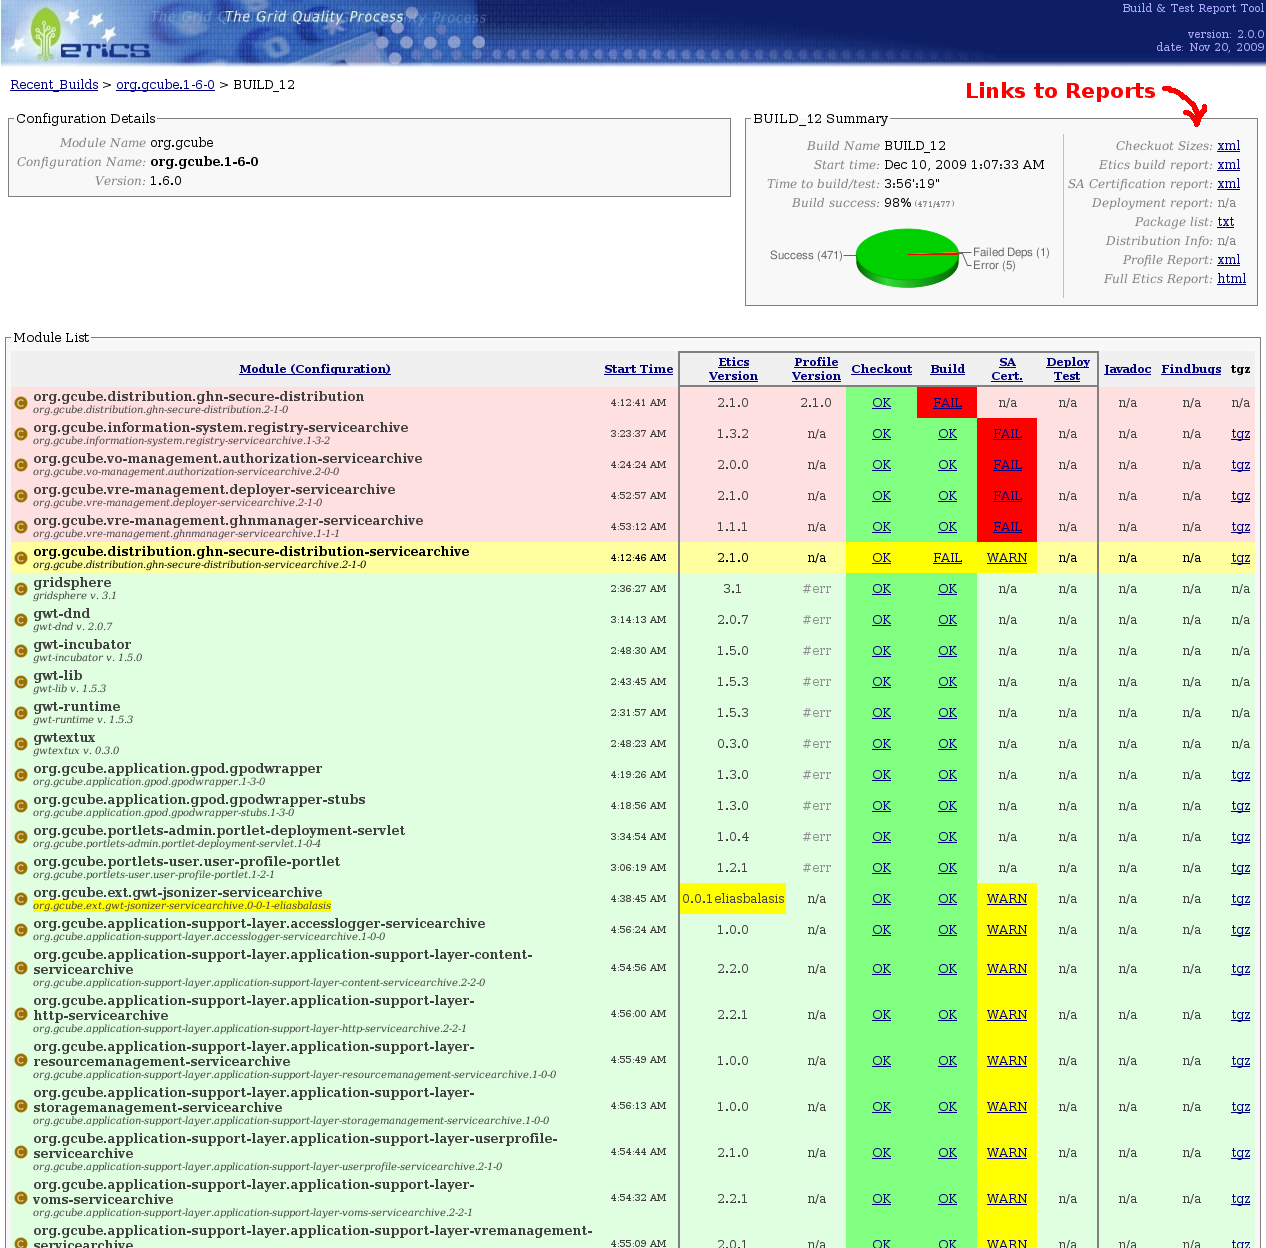
From the configuration's build list, by clicking on a build name, the build_home page will be displayed containing all information about that actual build.
In this page, under two panels of statistics and global reports links placed at the top of page, there is a "huge" table that reports a number of information about modules' build and test. For each module, name, ETICS configuration name, ETICS version, profile version are displayed. Furthermore, checkout, build, sa-certification, deployment testing, javadoc and findbugs process' status (OK, FAILED, WARNING,...) is displayed and logs are downloadable (if available). Finally, the last column provides a link to download the module artefact produced by build process.
By default modules table is sorted by problematicity: modules with problems are at the top. In this way it is easy to recognize problems. Anyway, by clicking on columns headers, users can decide the table sorting (e.g. alphabetically).
Colors in table are meaningful and useful to have the perception of build status at a glance. With regards to rows background color, they can be colored in:
- red: build failed
- yellow: build failed, but, since a component's dependency failed, that could be not a component itself fault
- green: component (and, obviously, all his dependencies) build successfully


