Difference between revisions of "BTRT"
(Created page with '== Introduction == BTRT stands for '''B'''uild and '''T'''est '''R'''eport '''T'''ool and it is a web application developed expressly to provide access to statistics, logs and re…') |
(→Repository Level) |
||
| Line 17: | Line 17: | ||
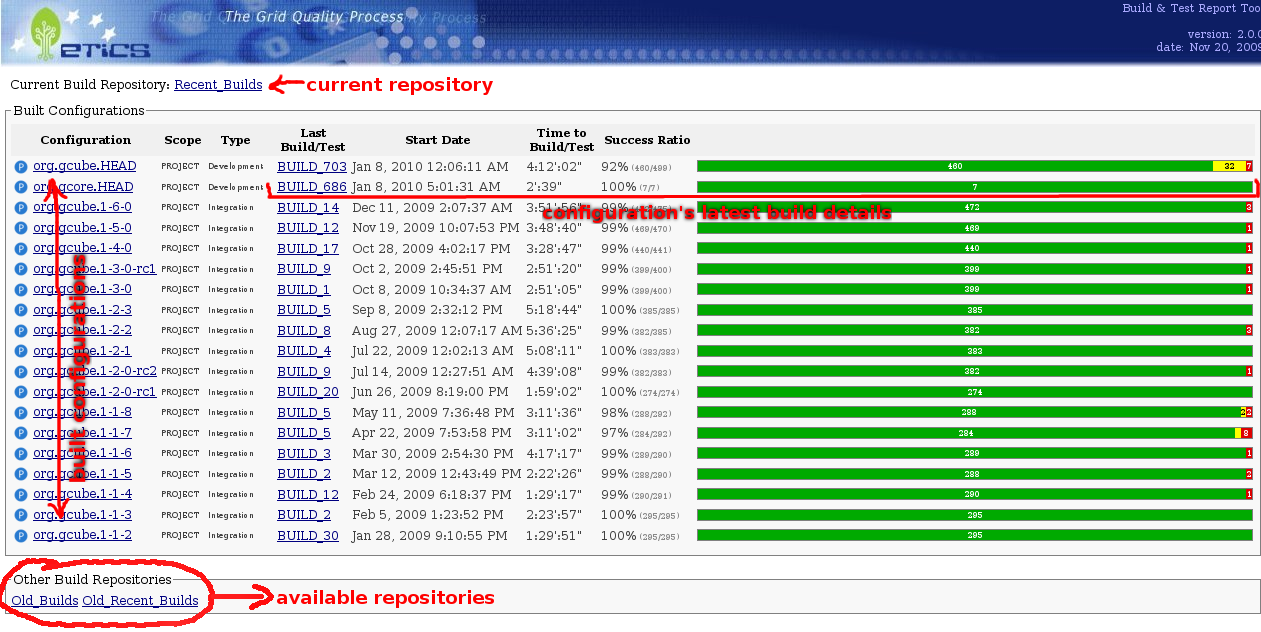
| − | [[Image: | + | [[Image:BTRT_homepage.png|center|800px|BTRT homepage]] |
Built-Configurations list provide, for each configuration, information about latest build executed for that configuration and its statistics (timing, compiling results). | Built-Configurations list provide, for each configuration, information about latest build executed for that configuration and its statistics (timing, compiling results). | ||
| − | |||
=== Configuration Level === | === Configuration Level === | ||
Revision as of 09:31, 11 January 2012
Contents
Introduction
BTRT stands for Build and Test Report Tool and it is a web application developed expressly to provide access to statistics, logs and reports produced during Continuous Integration and Release/Maintenance cycles of gCube software. It is used by Release Managers, Subsystem Managers and Developers to quickly identify integration, deployment and functional defects in software being released.
Running instances of BTRT
Currently, there are two running instances of BTRT:
- the official production version at: http://grids16.eng.it/BuildReport/
- the development version (that includes new functionalities, though less stable) at: http://grids16.eng.it/BuildReportDevel/
BTRT in detail
BTRT application provide data (statistics, logs, reports) at three different abstraction levels: repository level, configuration level and build level. All data available in BTRT is hosted in one or more Build Repository. From this point of view, BTRT can be considerated an application that browse a Build Repository. Indeed BTRT is much more than this since it computes useful reports starting from "raw" data available in repositories. BTRT is structured in three levels (like data it provides): Repository, Configuration and Build Level. In next sections an in-depth explanation of each level is provided.
Repository Level
The entry point to BTRT application is the list_repository page that lists all built configurations available in the selected repository. BTRT has a default repository, but users can decide time by time the repository they wants to inspect.
Built-Configurations list provide, for each configuration, information about latest build executed for that configuration and its statistics (timing, compiling results).
Configuration Level
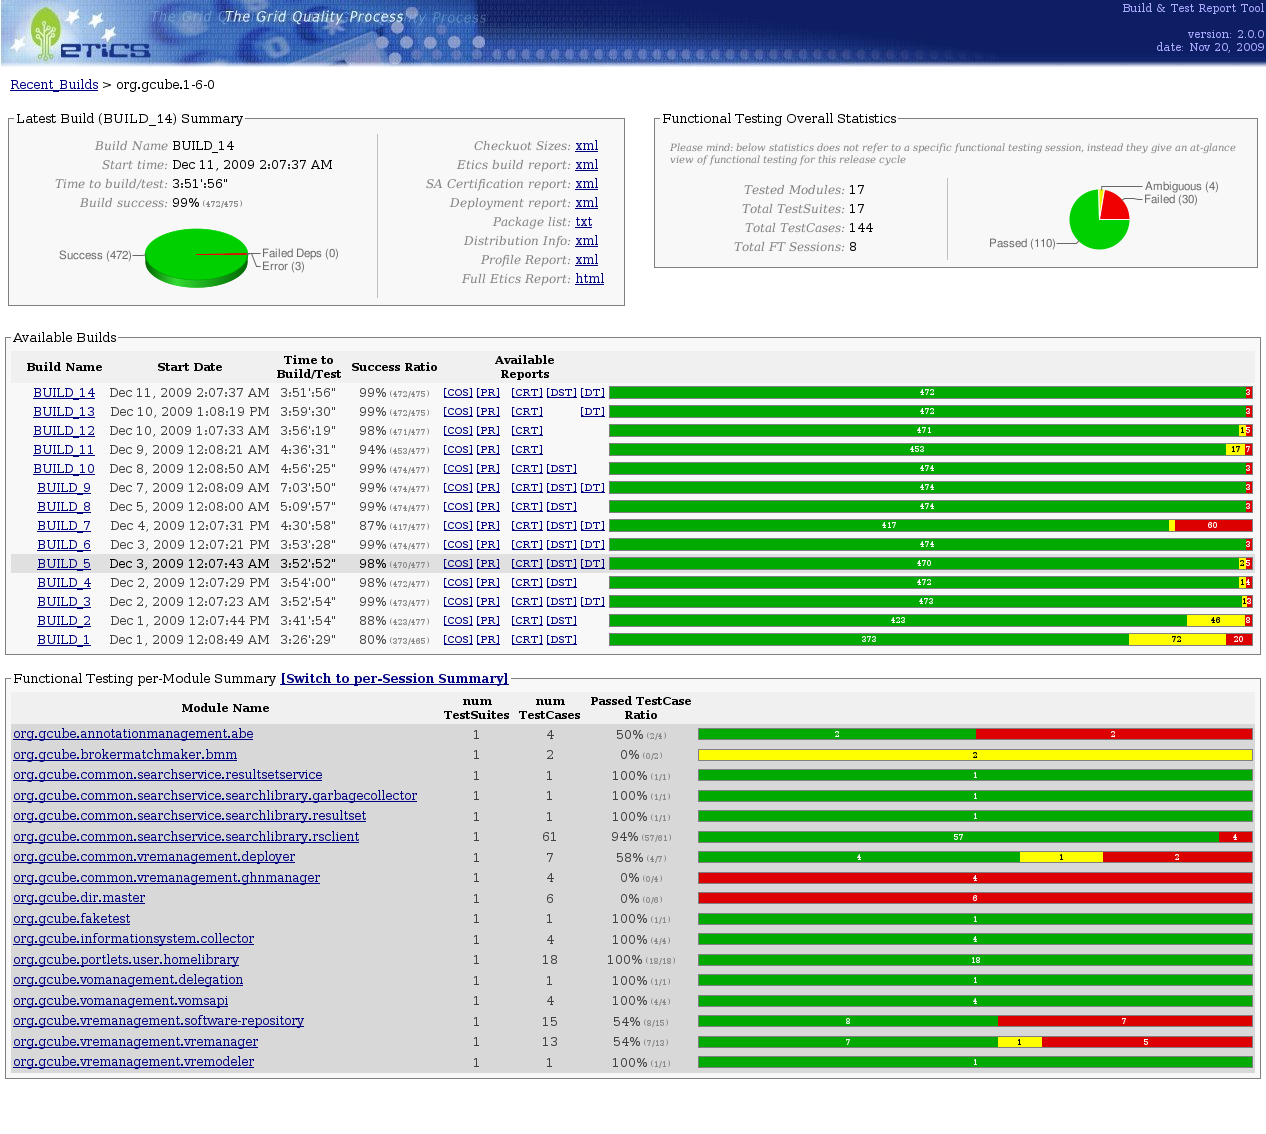
By clicking on one of configurations' name in BTRT homepage, the configuration_home will appear. This page is composed by four panels:
- Latest Build Summary: time statistics and reports links about latest build executed for the configuration
- Functional Testing Overall Statistics: an overview on Functional Testing status for the configuration
- Available Builds: The list of all builds executed for the configuration
- Functional Testing per-Module (per-Session) Summary: List of Functional Testing sessions executed against the configuration (see More on Functional Testing Reports section for further information)
Build Level
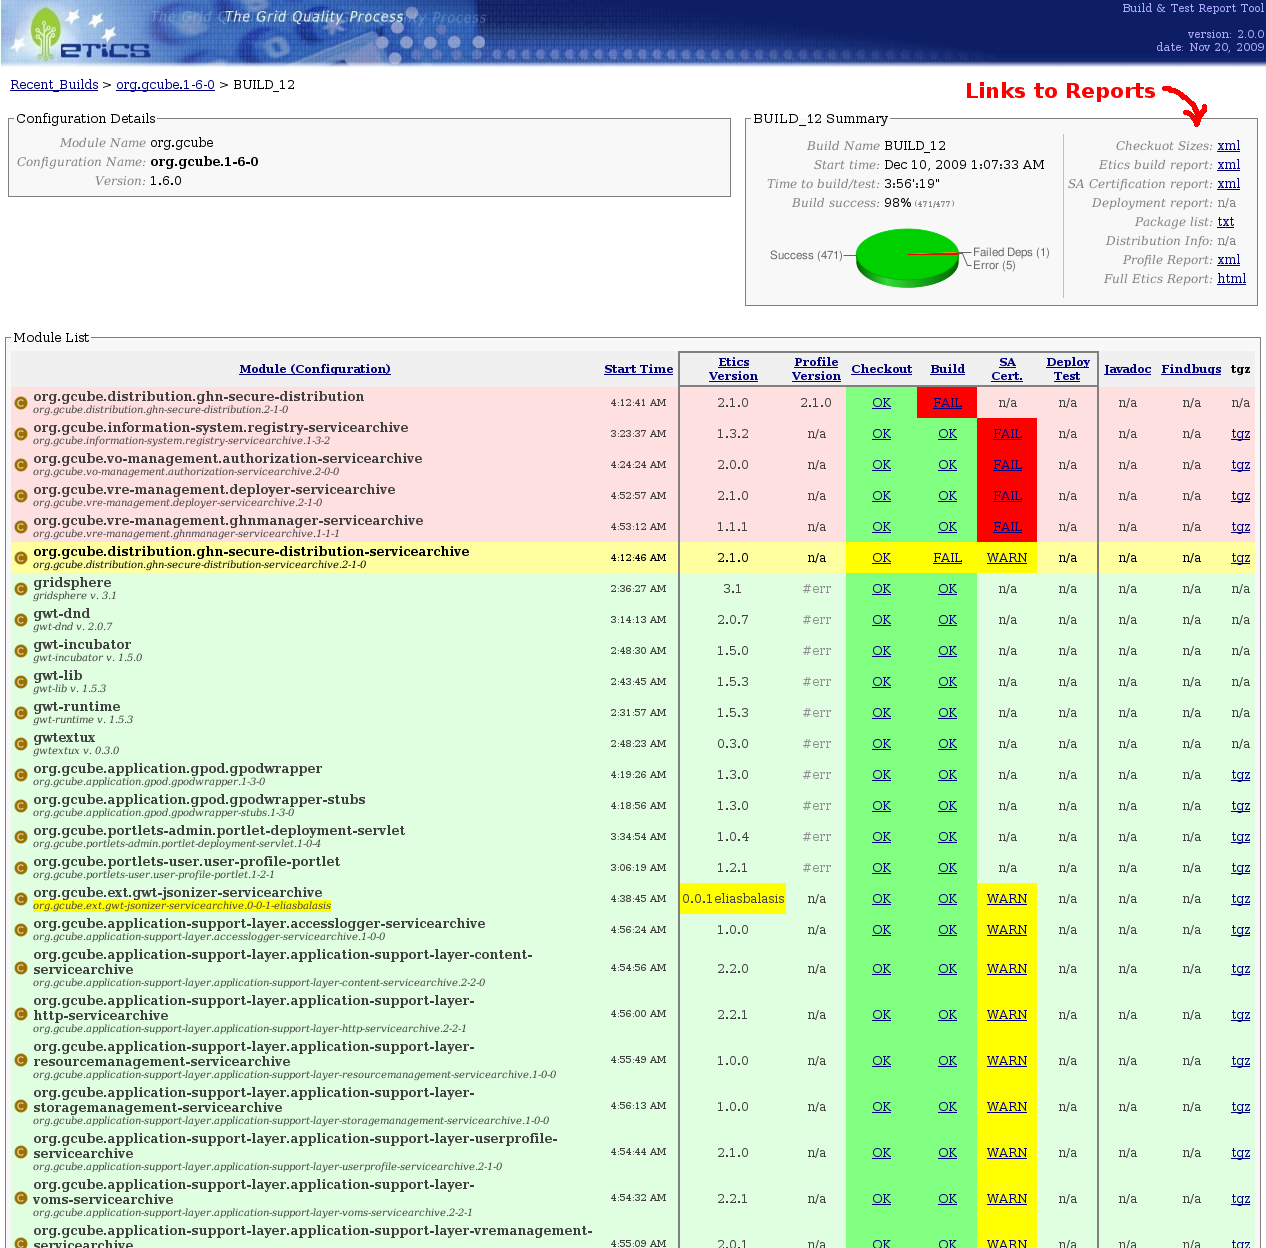
From the configuration's build list, by clicking on a build name, the build_home page will be displayed containing all information about that actual build.
In this page, under two panels of statistics and global reports links placed at the top of page, there is a "huge" table that reports a number of information about modules' build and test. For each module, name, ETICS configuration name, ETICS version, profile version are displayed. Furthermore, checkout, build, sa-certification, deployment testing, javadoc and findbugs process' status (OK, FAILED, WARNING,...) is displayed and logs are downloadable (if available). Finally, the last column provides a link to download the module artefact produced by build process.
By default modules table is sorted by problematicity: modules with problems are at the top. In this way it is easy to recognize problems. Anyway, by clicking on columns headers, users can decide the table sorting (e.g. alphabetically).
Colors in table are meaningful and useful to have the perception of build status at a glance. With regards to rows background color, they can be colored in:
- red: build failed
- yellow: build failed, but, since a component's dependency failed, that could be not a component itself fault
- green: component (and, obviously, all his dependencies) build successfully
More on Functional Testing Reports
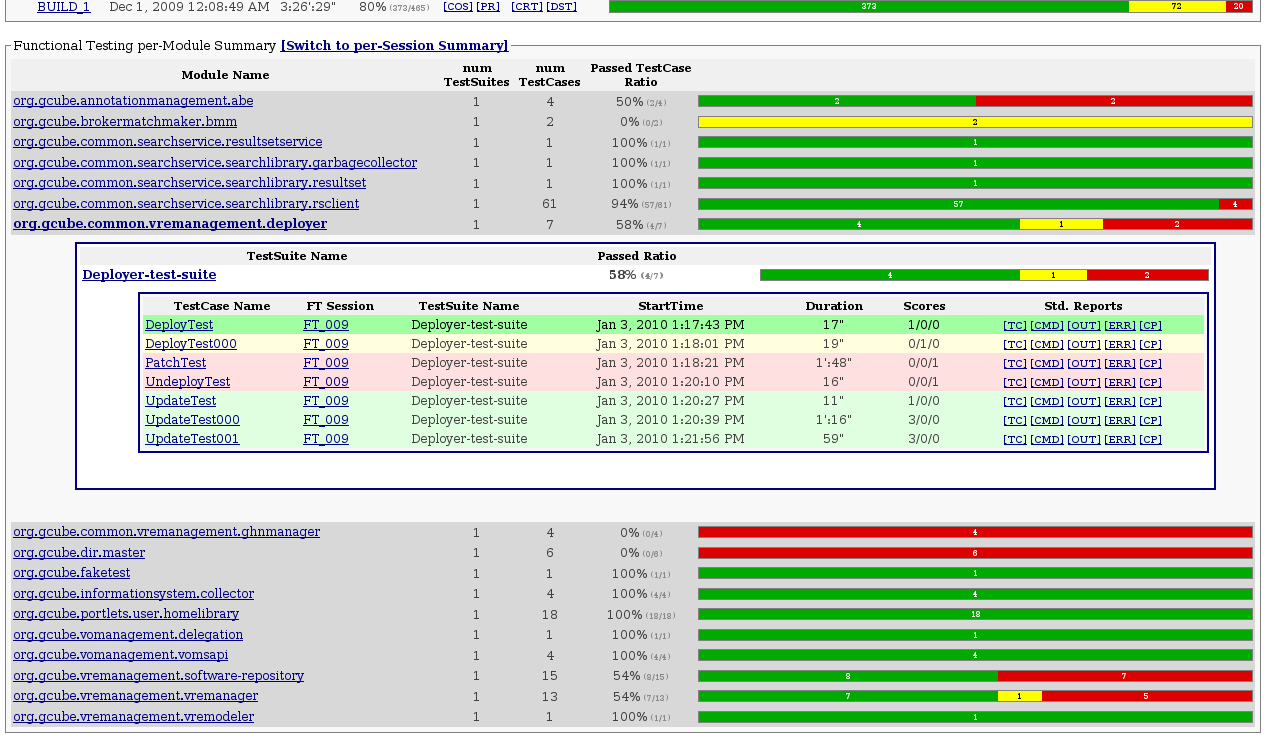
Functional Testing reports are located at configuration level, thus they are browsable starting from configuration_home" page. In this page there is the a panel (just after the "Available Builds" panel) that can shows functional testing reports in two modes:
- per-Module view: for each module, latest execution of test-suite for the module is displayed. In case a module does not have any test-suite, it is not displayed in the list. By clicking on rows, they are expanded and detailed reports for test-suites and than for test-cases executions are displayed.
- per-Session view: this is, simply, the list of all ft sessions executed for the configuration.
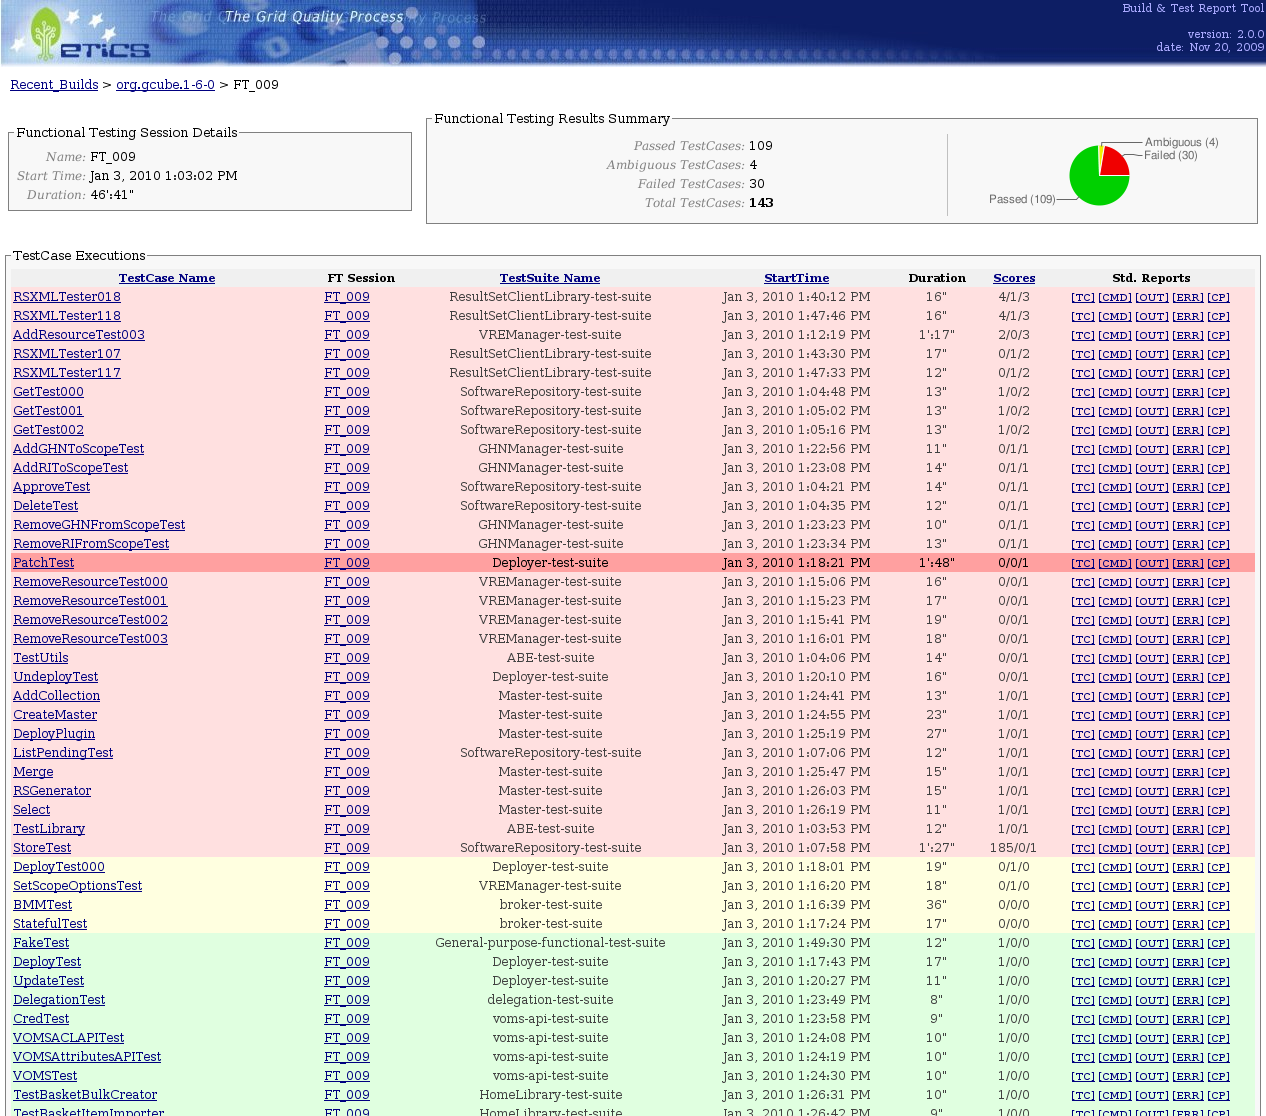
By clicking on a Functional Testing Session name (either in per-Session or per-Module view) the functional_testing_sesssion_home page will be load. This page shows the list of all test-cases executed in the ft session (Figure below shows up a part of that page)
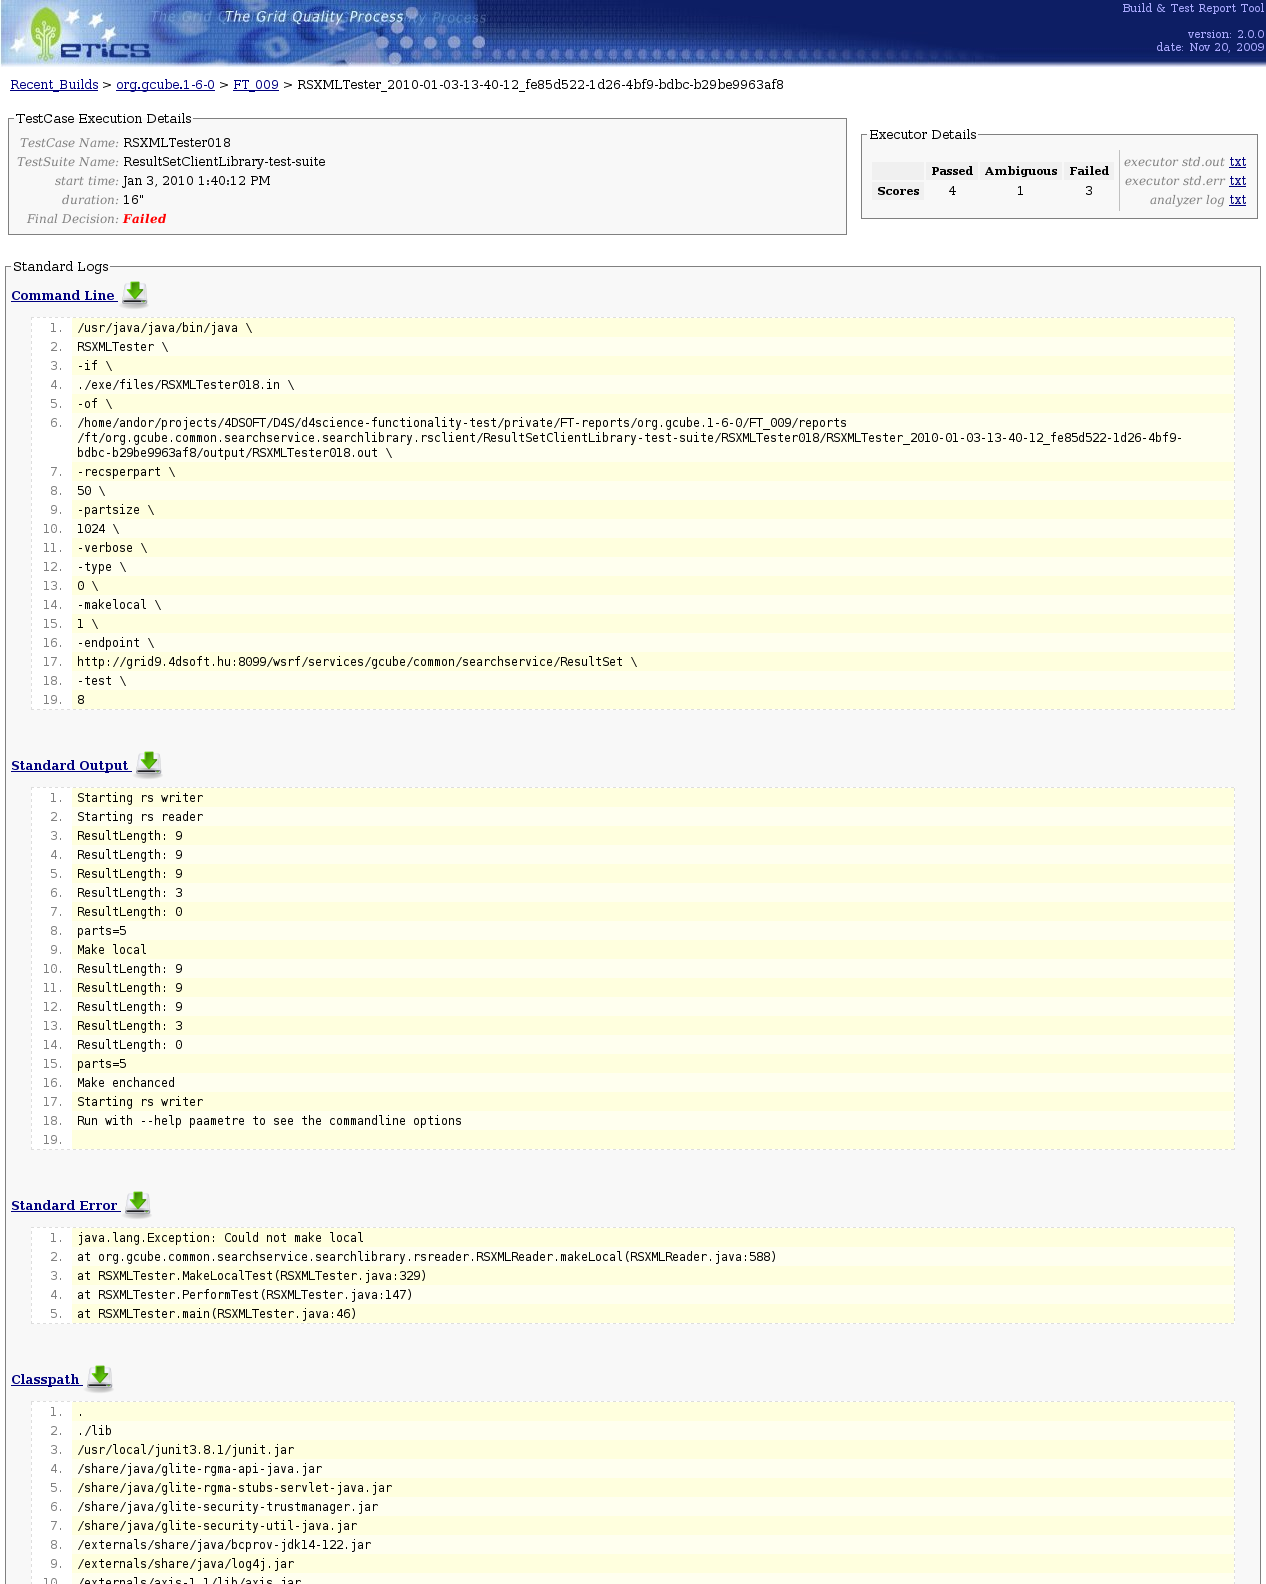
Finally, by clicking on Test-case Execution name the test-case_execution_home page will be displayed in which details about execution are collected. In particular logs (std.output, std.error, std.in, ...) are printed out (and downloadable).
Changelog
BTRT2-rc4 [2009.11.20]
- functional test reports integration (this includes a numebr or new pages/panels)
- stronger urls checks in BrowseServlet class
BTRT2-rc3 [2009.10.26]
- URLs format has been slightly redesigned in order to reflect the physical resources position on filesystem. Now BTRT URLs are almost equal to URLs used in etics repository.
- added "Etics Reports" link in reports-panel (in the upper right corner)pointing at the full report generated by ETICS. This allow to browse build reports in the same way you browse a classical report of build executed on etics infrastructure.
- better handling of invalid builds. Now they are not ignored anymore, but shown in the build list and marked as "--invalid build--"
NOTE: this release breaks the compatibility with previous versions, since it creates cache files also for invalid builds. Previous versions attempts to load invalid builds from cache and handle them as normal builds (and this will raise an exception sooner or later)
BTRT2-rc2 [2009.10.01]
- for a given module, in case certification fails, deployment report is not shown as available (since, for sure, the deployment test refers to an old version of that module)
- added support for build-status.xml files generated by new etics clients (up to version 1.3.10-1)
- now the method hasFailDeps() operate recursively on dependencies tree
BTRT2-rc2 [2009.08.27]
- first refactored version of btrt released
2009.06.16
- 0.0.0 versions are marked as RED
- mismatches between configuration name and etics version fields are marked in YELLOW
2009.06.11
- fixed bug in counting services in a subsystem
- removed AuthN/AuthZ
- name comparator is now case-insensitive
2009.02.06
- added list of available reports beside coloured bars
2008.11.20
- findbugs reports published (summary info taken from build-status.xml)
2008.11.05
- DT reports are now shown
