Difference between revisions of "Tabular Data Manager"
From Gcube Wiki
(→Overview) |
(→Basic of Interface) |
||
| Line 29: | Line 29: | ||
;Main area | ;Main area | ||
:The interface offer on center side a panel in which the grids with data be activated. | :The interface offer on center side a panel in which the grids with data be activated. | ||
| − | [[Image: | + | [[Image:tabular_data_manager_main1.png|frame|center|Tabular Data Manager, main area]] |
== Basic Operation == | == Basic Operation == | ||
Revision as of 16:17, 28 January 2015
This is the user guide to Tabular Data Manager portlet.
Overview
Tabular Data Manager offers facilities supporting the management of the entire life-cycle(creation, curation, manipulation and publication) of Tabular Resources such as datasets, codelist or generic table. i.e. tabular data representing observations of a given event or phenomenon at different time intervals. Tabular Resource are used in many domains ranging from statistics to signal processing and econometrics. Tabular Data Manager offers a rich set of facilities ranging from those supporting the assessment of data correctness to those supporting the verification of the compliance of data with given code lists, the aggregation and filtering of data.
Basic of Interface
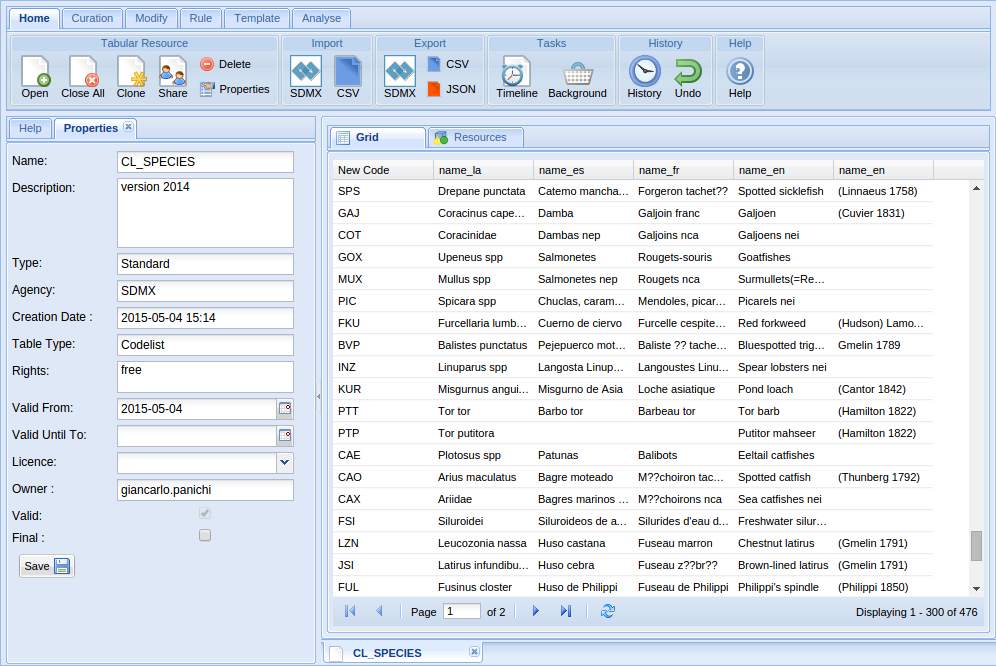
Composition of interface :
- Ribbon menu
- The interface offer on top a ribbon menu, it consists of tabs: Home, Curation, Modify and Analyse.
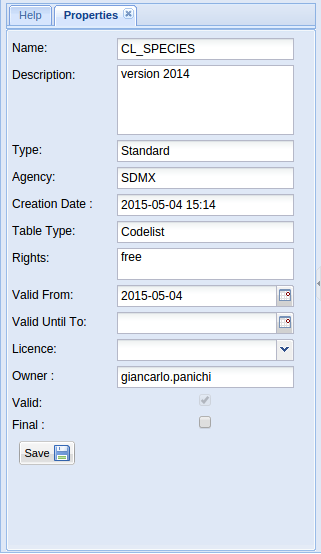
- Tools area
- The interface offer on left side a tab panel in which the manipolation tools will be activated.
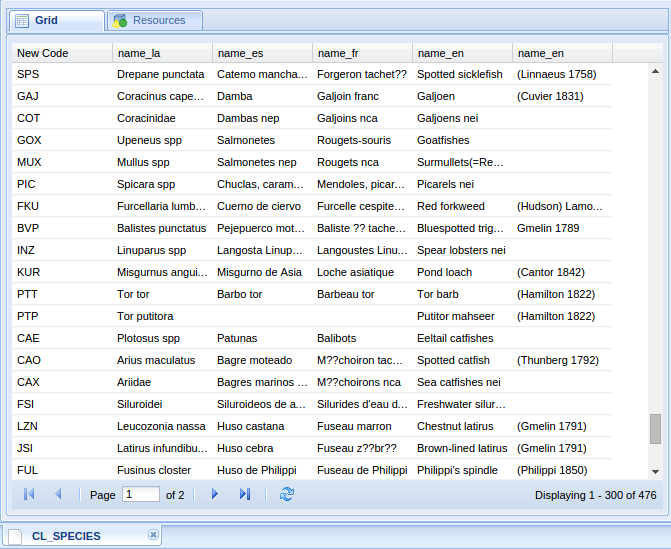
- Main area
- The interface offer on center side a panel in which the grids with data be activated.


