GIS Viewer
GisViewer is a web application system that allows you to interactive explore, manipulate and analyze geographic data.
Overview
The goal is to provide a standalone interactive analysis tools for information that has one or more spatial characteristics, such as environment maps, geospatial areas, points of occurrence, and so on, all in a web app that must have a simple and intuitive interface that is also the most general possible.
Design
Philosophy
GisViewer is based on Exploratory Data Analysis (EDA) approach, using synergistically computer capabilities to do complex calculations and the man's ability to identify cognitive patterns.
The web-app uses the layer concept: a layer is a minimal visual form of spatial data, it can be a region map, a vector (such as a points set), a variables distribution, and so on. The GisViewer can show one or more layers in an interactive map, allowing users to dissect both information of a layer, and the relationships between more layers. It's possible to examinate more overlapped layers, by set their transparencies, formats and filters. Tabular geospatial data can be extract by interactive selectiion of geographical area. Finally, geospatial data can be exported using several output formats.
Architecture
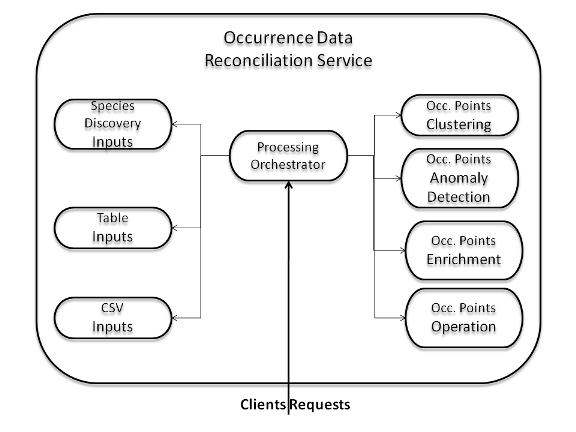
The subsystem comprises the following components:
- Inputs Managers: a set of internal processors which manage the variety of inputs that could come from users or from other services;
- Occurrence Point Processors: a set of internal objects which can invoke external systems in order to process data or extract hidden properties from them. These include Clustering, Anomaly Points Detection etc.;
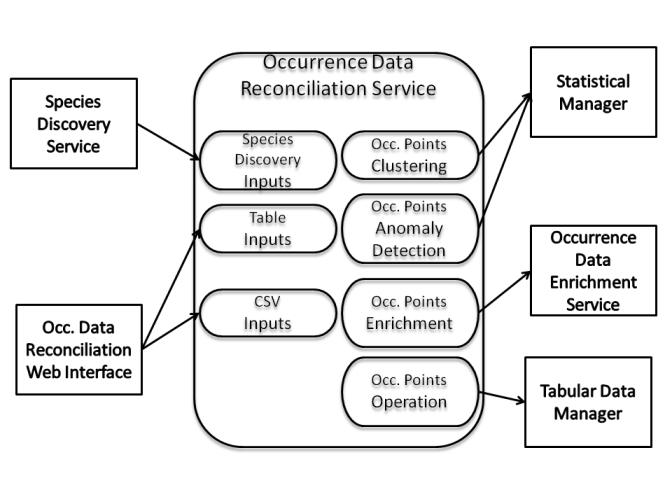
- Occurrence Points Enrichment: a connector to another d4Science service (the Occurrence Enrichment Service) dealing with the enrichment of occurrence points associated information, which is able to add indications about the chemical and physical characteristics of the oceans and earth;
- Occurrence Points Operations: a connector to another d4Science interface which is able to operate on tabular data, by performing visualization, aggregation and transformations.
- Processing Orchestrator: an internal process which manages the interaction and the usage of the other components. It accepts and dispatches requests coming from outside the service.
A diagram of the relationships between these components is reported in the following figure:
Deployment
All the components of the service must be deployed together in a single node. This subsystem can be replicated on multiple hosts and scopes, this does not guarantee a performance improvement because it is a management system for a single input dataset.
Small deployment
The deployment follows the following schema as it needs the presence of other complementary services.
Use Cases
Well suited Use Cases
The subsystem is particularly suited when experiment have to be performed on occurrence points referring to a certain species or family. The set of operations which can be applied, even lying on state-of-the-art and general purpose algorithms, have been studied and developed for managing such kind of information.

