Messaging Infrastructure
Contents
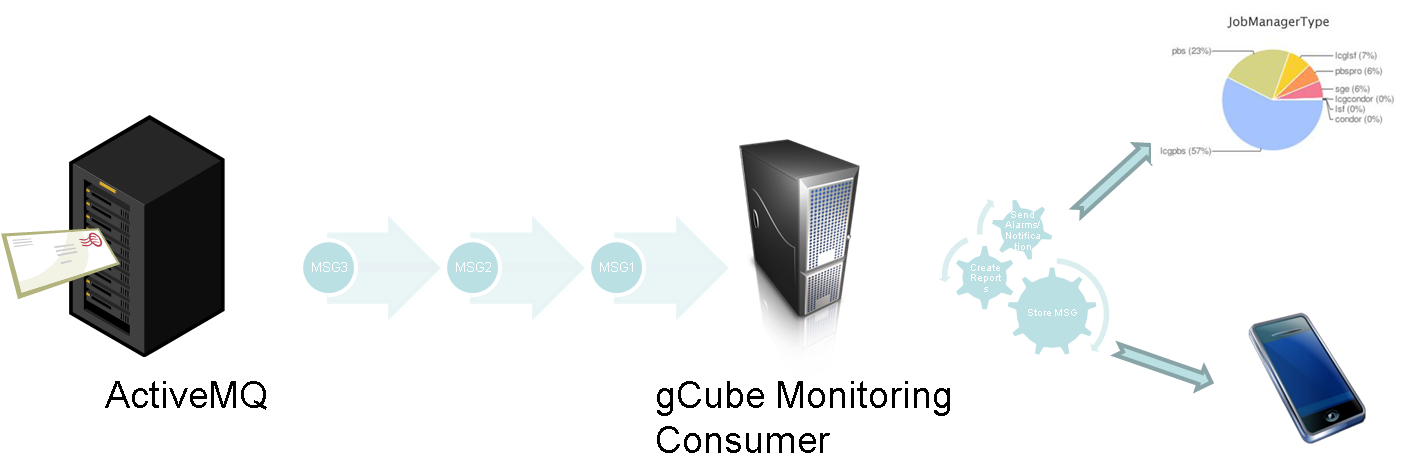
gCube Messaging Architecture
Tools to gather accounting data are important tasks within the infrastructure operation work. As a consequence, D4Science decided to implement accounting tools also based on a messaging system to satisfy the need to provide accounting information.
These accounting tools have been implemented under a gCube subsystem called gCube Messaging cause it exploits the messaging facilities from JAVA. This section presents the architecture and core components of such subsystem.
The gCube Messaging subsystem is composed by several components:
- Message Broker – receives and dispatches messages;
- Local Producer – provides facilities to send messages from each node;
- two versions are available one for gCore services and one for Smartgears/Portal services based on FWS
- Node Accounting Probes – produces accounting info for each node;
- Portal Accounting Probes – produces accounting info for the portal;
- System Accounting Library – produces custom accounting information for gCube services
- Messages – defines the messages to exchange;
- Messaging Consumer – subscribes for messages from the message broker, checks metrics, stores messages, and notifies administrators.
- Messaging Consumer Library – hides the Consumer DB details helping clients to query for accounting and monitoring information
- Portal Accounting portlet – a GWT based portlet, that shows to Infrastructure managers portal usage information
- Node Accounting portlet – a GWT based portlet, that shows to Infrastructure managers service usage information
Message Broker
Following the work that has been done by the [1]WLCG Monitoring group at CERN on Monitoring using MoM systems, and to potentially make interoperable the EGI and D4science Monitoring solution, the [2]Active MQ Message Broker component has been adopted in D4Science has standard Message Broker service.
The Apache ActiveMQ message broker is a very powerful Open Source solution having the following main features:
- Message Channels
- Publish-Subscribe (Topics)
- Point-to-Point (Queue)
- Virtual Destination, WildCards
- Synchronous, Asynchronous sending
- Wide Range of supported protocol for clients
- Open Wire for high performance clients
- STOMP
- REST, JMS
- Extremely good performance and reliability
- Is it possible to check the [3] Performance Test executed by WLCG Monitoring group.
Installation
The Installation instruction for the Active MQ broker can be found at [4].
Local Producer
The Local Producer is the entity deployed on each node of the infrastructure responsible for the messages exchange. It defines the methods to communicate with the Message Broker and is activated at node start-up (if configured to do so).
GCore version
The Local Producer is structured in two main components:
- An abstract Local Producer interface. This interface is part of the gCore Framework (gCF) and models a local producer, a local probe, and the base message.
- An implementation of the abstract Local Producer. This implementation class has been named GCUBELocalProducer.
The GCUBELocalProducer, at node start-up, sets up one connection towards the Message Broker:
- Queue connections: exploited by accounting probes that produce messages consumed by only one consumer;
FWS version
The Local Producer interface is included directly in the producer-fws component, in order to drop dependencies towards GCF.
Configuration
In order to configure the GHN to run the gCube Local Producer, at least one MessageBroker ( an Active MQ endpoint) must be configured in the scope where the GHN is running.
Please refer to the Messaging Endpoints guide to understand how to configure the MessageBroker endpoint.
Node Accounting Probe
The Node Accounting Probe is in charge of collecting information about local usage of gCube services. The probe is a library deployed on each gHN that exploits the mechanisms offered by gCF to understand the usage of the services on the infrastructure. For each incoming method call, gCF produces a record log as follows:
END CALL FROM (146.48.85.127) TO (Messaging:Consumer:queryAccountingDB),/d4science.research-infrastructures.eu,Thread[ServiceThread-1039,5,main],[0.847]
Each “END CALL” line contains information about:
- Time
- Running Instance invoked
- Method invoked
- Caller scope
- Caller IP
- Invocation Time
The probe parses this type of log files every aggregation interval ( configurable ) and aggregates information per running instance. In particular the information is aggregated following this schema: RI -> CallerScope -> CallerIP -> Number of Invocations and Average Invocation Time.
The information about the invoked method is not parsed since it has been decided not to expose this granularity of information.
At the end of the aggregation process, the probe creates node accounting messages that are sequentially send to the Message Broker using the Local Producer.
For this particular type of messages a queue receiver is exploited on Message Broker side.
IS Integration
The Node Accounting Probe is able to publish some aggregated Accounting information on the gCube IS. In order to allow publication of information the gCube Running instance profile has been extended as in the following example:
<Accounting>
<ScopedAccounting scope="/d4science.research-infrastructures.eu">
<TotalINCalls>2353</TotalINCalls>
<AverageINCalls interval="10800" average="0.0" />
<AverageINCalls interval="3600" average="0.0" />
<AverageINCalls interval="18000" average="0.0" />
<AverageInvocationTime interval="10800" average="1.786849415204678" />
<AverageInvocationTime interval="3600" average="5.031631578947368" />
<AverageInvocationTime interval="18000" average="2.3127022417153995" />
<TopCallerGHN avgHourlyCalls="30.4142155570835507" avgDailyCalls="730.0" totalCalls="730">
<GHNName>137.138.102.215</GHNName>
</TopCallerGHN>
</ScopedAccounting>
</Accounting>
The Accounting section contains, for each RI caller scope:
- Total Number of calls
- Average number of Incoming calls ( calculated over 3 different value of interval )
- Average Invocation time ( calculated over 3 different value of interval )
- Top caller GHN
- average daily calls
- average hourly calls
- total calls
Configuration
Node Accounting configuration is driven by the NodeAccounting.properties file contained in the $GLOBUS_LOCATION/config folder:
#Configuration for NodeAccounting probe

#the probing interval ( logs Aggregation interval in sec and  IS publication interval)
PROBING_INTERVAL=3600

#publication of accounting info for each RI on the IS
PUBLISH_ON_IS=true
Portal Accounting Probe
The Portal Accounting Probe is in charge of aggregating information about portal usage. As for the node accounting, the portal (and in particular the ASL library) produces a log record, describing the following operations:
- Login
- Browse Collection
- Simple Search
- Advanced Search
- Content Retrieval
- QuickSearch
- Archive Import scipts creation,publication and running.
- Workspace object operations
- Time Series import, delete, curation
This is an example of one log record produced by the D4science portal:
2009-09-03 12:22:37, VRE -> EM/GCM, USER -> andrea.manzi, ENTRY_TYPE -> Simple_Search, MESSAGE -> collectionName = Earth images
The common information between each type of log is:
- Time
- User
- VRE
- OperationType
- Message
The message part differs between each type of log record, for example for the simple search record contains info about the collections included in the operation and term searched. The portal accounting probe aggregates portal accounting information by creating a number of Portal Accounting messages aggregated by: User -> VRE -> OperationType. Each message contains a certain number of records of one OperationType.
As in node accounting, at the end of the aggregation process the probe sequentially sends to the Message Broker using the Local Producer a number of portal accounting messages. For this particular type of messages a queue receiver is exploited on Message Broker side.
Log filters configuration
The Portal Accounting probe can be configured to apply filters before the portal logs aggregation in order to discard unwanted records (e.g. records coming from testing users).
This particular behavior is implemented trough the bannedList.xml configuration file ( to be placed on $CATALINA_HOME/shared/d4s). The file contains some exclude filters based on exact or partial matching of the USER part of the log file:
<?xml version="1.0" encoding="UTF-8"?>
<Exclude>
<Contains>Manager_</Contains>
<Equal>test.user</Equal>
<Equal>user</Equal>
<Equal>AquaMaps_generic_User</Equal>
<Equal>null</Equal>
</Exclude>
System Accounting
The goal of the System Accounting is to allow any gCube service or client to account their own custom information within the D4science infrastructure
As the other type of accounting, it exploits the Messaging Infrastructure to deliver the message containing the accounting info to the proper instance of the Messaging Consumer for storage and future querying. In particular each time a new Accounting Info is generated a new message is enqueued into the local Local Producer which is in charge to dispatch it to the proper Message Broker instance. The Consumers in charge to process this kind of message, will then be notified and will store the information on their System Accounting DB. Each type of message is considered as a new table on the System Accounting DB
Creating a System accounting info
The System Accounting Library contains methods for the generation of System Accounting information, both within gCube services and gCube clients. The querying facilities have been implemented inside the Consumer library which is the entry point for any kind of information retrieval related to accounting and monitoring.
In order to generate a system accounting information from a gCube client the following code can be executed:
        SystemAccounting acc = SystemAccountingFactory.getSystemAccountingInstance();
	String type = "TestType6";
	HashMap<String,Object> parameters = new HashMap<String,Object>();
	parameters.put("executions",10);
	parameters.put("testParameter","andrea");

	String sourceGHN="pcd4science3.cern.ch:8080";
	GCUBEScope scope = GCUBEScope.getScope("/gcube");
	acc.sendSystemAccountingMessage(type, scope, sourceGHN,parameters);
In the case of usage inside a gCube container, the information about scope, sourceGHN, RI serviceClass and service Name are automatically filled from the gCube Service contenxt. An example of usage would be:
        SystemAccounting acc = SystemAccountingFactory.getSystemAccountingInstance();

	String type = "MessagingConsumerType";
	HashMap<String,Object> parameters = new HashMap<String,Object>();
	parameters.put("restarted",Boolean.TRUE);
	parameters.put("time", Calendar.getInstance().getTime());
	acc.sendSystemAccountingMessage(ServiceContext.getContext(), type, parameters);
In this case for each RI scope a message is enqueued. In order to send only one message related to only one scope, the following method can be executed instead:
acc.sendSystemAccountingMessage(ServiceContext.getContext(), type, parameters,scope);
There is a restrictions on the types of the parameters to send trough Accounting System, the following Java types are supported:
- java.lang.String
- java.math.BigDecimal
- java.lang.Boolean
- java.lang.Integer
- java.lang.Long
- java.lang.Float
- java.lang.Double
- byte[]
- java.sql.Date
- java.sql.Time
- java.sql.Timestamp
- java.sql.Clob
- java.sql.Blob
- java.sql.Array
- java.sql.Struct
- java.sql.Ref
In the case of an unsupported Java type an IllegalArgumentException will be thrown by the library. In addition the library is checking if some of the custom parameters name entered by the users are clashing the ones reserved to the system ( e.g. scope). In this case a ReservedFieldException will be thrown.
Consumer Library
The Consumer Library has been developed to give clients the ability to query for Monitoring and Accounting Info. Apart from the retrieval of DB Content, the library exposes facilities to parse results as JSON Objects and aggregate information for the creation of statistics.
The latest version of the library (2.1.0-SNAPSHOT) and the related javadoc is availablae on Nexus at [5].
In case of integration with a maven components the dependency to be included in the pom file is:
<dependency>
  <groupId>org.gcube.messaging</groupId>
  <artifactId>consumer-library</artifactId>
  <version>2.1.0-SNAPSHOT</version>
</dependency>
As said the library offers method to retrieve Accouting and Monitoring infos:
Accounting
The Consumer Library can be used on order to query for Accounting data. The Consumer service can be configured to retrieve 3 type of accounting informations;
- Portal: accounting information related to activity performed by users trough portlets
- Node: accounting information related to WebService invocations ( to be replaced by ResourceAccounting)
- System: accounting info of any type , to be customize by the service collecting them. ( to be replaced by ResourceAccounting)
Querying for Portal Accounting info
The Consumer Library need to be instantiated in a predefined scope
ScopeProvider.instance.set("/gcube");
ConsumerCL library = Proxies.consumerService().withTimeout(1, TimeUnit.MINUTES).build();
With this kind of initialisation the library is going to use the InformationSystem in order to find an instance of the Consumer Service in the selected scope.
Then it's possible to specify the type of query to perform:( in this case Portal Accounting)
PortalAccountingQuery query = library.getQuery(PortalAccountingQuery.class,library);
The available methods to query Portal Accounting information are:
- public <TYPE extends BaseRecord> String queryByType (Class<TYPE> type)
- public String queryByType (String type,String []date) throws Exception
- public <TYPE extends BaseRecord> String queryByUser (Class<TYPE> type, String user, String ... scope )
- public String queryByUser (String type, String user, String []date,String ... scope )
- public <TYPE extends BaseRecord> Long countByType (Class<TYPE> type,String ... scope)
- public <TYPE extends BaseRecord> Long countByUser (Class<TYPE> type,String user,String ... scope)
- public Long countByType (String type,String ... scope)
- public Long countByUser (String type,String user,String ... scope)
- public String countByTypeAndUserWithGrouping (String type,String groupBy,String []dates, String ...user )
- public <TYPE extends BaseRecord> ArrayList<PortalAccountingMessage<TYPE>> getResultsAsMessage(Class<TYPE> type)
In the case of a result type as String , the result type is a JSON String.
Querying for Node Accounting info
The Consumer Library need to be instantiated in a predefined scope
ScopeProvider.instance.set("/gcube");
ConsumerCL library = Proxies.consumerService().withTimeout(1, TimeUnit.MINUTES).build();
With this kind of initialisation the library is going to use the InformationSystem in order to find an instance of the Consumer Service in the selected scope.
Then it's possible to specify the type of query to perform:( in this case Node Accounting)
NodeAccountingQuery query = library.getQuery(NodeAccountingQuery.class,library);
The available methods to query Node Accounting information are:
- public InvocationInfo getInvocationPerInterval(String serviceClass, String serviceName, String GHNName, String startDate,String endDate, String ...callerScope )
- public InvocationInfo getInvocationPerInterval(String serviceClass, String serviceName, String startDate,String endDate, String ...callerScope )
- public String getInvocationPerInterval(String serviceClass, String serviceName, String GHNName,String startDate,
String endDate, String callerScope,String groupBy )
- public InvocationInfo getInvocationPerHour(String startDate,String endDate, String ...callerScope )
Querying for System Accounting info
First of all is it possible to query for the types ( table ) actually presents on the System Accounting DB:
ScopeProvider.instance.set("/gcube");
ConsumerCL library = Proxies.consumerService().withTimeout(1, TimeUnit.MINUTES).build();
SystemAccountingQuery query = library.getQuery(SystemAccountingQuery.class, library);

for (String str : query.getTypes())
   System.out.println(str);
In order then to query for the specific content of a table, we have 4 methods to be used:
- String getTypeContentAsJSONString(String tableName)
- JSONArray getTypeContentAsJSONObject(String tableName)
- String queryTypeContentAsJSONString(String query)
- JSONArray queryTypeContentAsJSONObject(String query)
In the case of JSONArray output's methods, is it possible to navigate over the results like in the following example:
for (String str : query.getTypes()){
    JSONArray object = query.getTypeContentAsJSONObject(str);
    for (int i = 0; i< object.length(); i++)
         System.out.println(object.getJSONObject(i).getString("id"));
}
In order to query using the two methods queryTypeContentAsJSONObject and queryTypeContentAsJSONString, any MySQL SELECT Statement can be used, while the usage of a different statement ( UPDATE, DROP..) will throw an exception.
The following fields are always present ( apart from serviceClass and serviceName which can be null) in a SystemAccounting record:
- id
- scope
- serviceClass
- serviceName
- sourceGHN
- datetime
Monitoring
Monitoring information are now collected using Nagios so this part is obsolete.
Messages
The Messages exchanged over the Infrastructure can be grouped into Accounting and Monitoring Messages.
Monitoring
The monitoring probes (GHN and RI probes) exchange with the Message Broker a particular type of messages (extensions to the base GCUBEMessage) named respectively GHNMessage and RIMessage. Both of them contain a particular object named “Test” that represents the test performed on the GHN (together with the result) or a Notification:
- TestType – either TEST or NOTIFICATION;
- Description – the test/notification description;
- TestNumber – a unique Identifier;
- TestResult – object that stores the TEST results; (in case of NOTIFICATION no results are expected_
- Priority – either HIGH or LOW.
The RIMessage also contains information about the ServiceClass and the ServiceName of the Running Instance where the probe is running. At message creation time, depending on the type of messages and type of probes, different combinations of topic names and message selectors are possible:
- GHN Message, TEST probe:
- scope.MONITORING.GHN.sourceGHN/MessageType='TEST'
- GHN Message, NOTIFICATION probe:
- scope.MONITORING.GHN.sourceGHN/MessageType='NOTIFICATION'
- RI Message, TEST probe:
- scope.MONITORING.RI.sourceGHN/MessageType='TEST'
- RI Message, NOTIFICATION probe:
- scope.MONITORING.RI.sourceGHN/MessageType='NOTIFICATION'
The monitoring probes, following the above topic structure, send messages for each scope of the GHN/RI. For example on a gHN running on node pcd4science.cern.ch and port 8080, that belongs to both /gcube and /gcube/devsec scopes, the GHNDiskProbe probe will send two messages with the following topic names:
- gcube.MONITORING.GHN.pcd4science_cern_ch:8080
- gcube.devsec.MONITORING.GHN.pcd4science_cern_ch:8080
Accounting
NodeAccountingMessage
The NodeAccountingMessage is a specialization of the generic GCUBEMessage. It’s used to transfer the details about the invocations received by a RI on a particular scope. It includes:
- RI service name and class
- Caller scope
- Invocation date
- Interval records composed by:
- Start Interval
- End Interval
- Service invocation number
- Average invocation time
- Caller IP
For accounting messages, the JMS destination is a queue. Instead of a topic naming structure, the message follows a queue naming structure:
scope.ACCOUNTING.GHN.SourceGHN
For example:
- gcube.ACCOUNTING.GHN.pcd4science_cern_ch:8080
- gcube.devsec.ACCOUNTING.GHN.pcd4science_cern_ch:8080
PortalAccountingMessage
The PortalAccountingMessage is a specialisation of the generic GCUBEMessage. The type of information to transport is rich and can vary considerably. The basic fields are: User and VRE. Then the message is structured to contain a list of Basic Record specialized in:
- LoginRecord
- AdvancedSearchRecord
- SimpleSearchRecord
- QuickSearch
- GoogleSearch
- BrowseRecord
- ContentRecord
- AISRecord
- TSRecord
- HLRecord
- AnnotationRecord
- GenericRecord (for generic operation logs)
All of the above records have in common only timestamp information. These messages as well as NodeAccountingMessages have a queue naming structure as follows:
scope.ACCOUNTING.PORTAL.SourceGHN
For example:
- gcube.ACCOUNTING.PORTAL.pcd4science_cern_ch:8080
SystemAccountingMessage
In the case of SystemAccounting, a SystemAccountingMessage is used instead. It's as well a specialisation of the generic GCUBEMessage. It contains a number of fixed fields and a fieldMap which contains a dynamic number of MessageField.
MessageFields type is composed by name, value, and SQLType.
These messages as well as the other accouting messages have a queue naming structure as follows:
scope.ACCOUNTING.SYSTEM.SourceGHN
For example:
- gcube.ACCOUNTING.SYSTEM.pcd4science_cern_ch:8080
Messaging Consumer
The Messaging Consumer is a gCube WSRF service that is deployed on the infrastructure to consume messages coming from Message Brokers. The main features of the service are:
- Subscribe to monitoring/accounting messages for different scopes;
- Check monitoring message test result against metrics;
- Store monitoring/accounting messages on local database;
- Send email notifications to admins in case of abnormal tests results;
- Provides a GUI with summary information
This WSRF service exposes public operations to allow queries to the underneath database and export information outside the infrastructure.
Following the messages topic structure the Messaging Consumer, at start-up time, creates (1) durable subscriptions towards topics, and (2) queue receiver towards queues. The Message Broker server will hold messages for a client subscriber after it has formally subscribed. Durable topic subscriptions receive messages published while the subscriber is not active. Subsequent subscriber objects specifying the identity of the durable subscription can resume the subscription in the state it was left by the previous subscriber. This means that using the same subscription ID the Messaging Consumer can resume the receipt of messages from the Message Broker server. This is very powerful, and it's useful in case of a node-crash or service re-deployment.
The Messaging Consumer also embeds a Message Broker for testing purposes. However in the production environment a dedicate Message Broker is deployed.
The Messaging Consumer can dynamically run in one or more scopes. According to the topic/queue structure defined, when a scope is added to its RI the service automatically subscribes for the following topics/queues:
- <scope>.MONITORING.GHN.*
- <scope>.MONITORING.RI.*
- <scope>.ACCOUNTING.GHN.*
- <scope>.ACCOUNTING.PORTAL.*
- <scope>.ACCOUNTING.SYSTEM.*
The Messaging Consumer Service can be configured using the “subscriptions” configuration variable, to subscribe only to a subset of the available information. In addiction the Messaging Consumer can be configured to use JMS message selectors. This means that for each scope 2*nOfSelectors durable subscribers are created using the wildcard (.*) syntax for TopicNames (all topic names of the same scope and type are subscribed for).
gCube Monitoring notifications
An important functionality of the Messaging Consumer is the capability to send notifications and daily reports to administrators/site managers by elaborating on the stored incoming messages. The administrators are selected trough a local configuration file, directly retrieved from VOMS, or by a configuration file stored on IS. The Messaging Consumer is configured to send email notification in two situations:
- When a message of type NOTIFICATION with HIGH priority (e.g. gHN start, shutdown) is received;
- When a message of type TEST and the test result exceed some threshold parameters (e.g. CPU usage, disk quota) is received.
Here an example of gCube Monitoring notification:
***** gCube Monitoring *****

Type: NOTIFICATION
GHN: node26.p.d4science.research-infrastructures.eu:8080
Address: node26.p.d4science.research-infrastructures.eu/146.48.85.192
Info: GHN shutdown event received

Date/Time: 2010-08-12 02:27:04
The Messaging Consumer embeds a Jetty web server in order to publish daily report. The first version of the report GUI, allows the admin to navigate trough reports grouped by day, scope, gHN name showing the related Notifications.
JNDI Configuration
The Consumer Service can be configured ( as any of the other gCube services) by adding/changing configuration parameters on the [6]JNDI service file. The following table describe the list of service parameters.
| Parameter | Type | Description |
|---|---|---|
| AccountingDBFile | String | The File containing the Structure for Accounting DB |
| MonitoringDBFile | String | The File containing the Structure for Monitoring DB |
| MailRecipients | String | The FIle containing the list of Fixed administrators mail , if present the list of admin mail is not downoaded from VOMS peridically |
| NotifiybyMail | Boolean | Specify if the mail notification feature has to be turned on |
| startScopes | String | List of scopes the Service belongs to |
| httpServerBasePath | String | the container related base path for the embedded [7]Jetty Webserver |
| httpServerPort | String | the port for the embedded [8]Jetty Webserver |
| monitorRoleString | String | the Role on the VOMS related to Site/VO Admin ( to be used when the service downloads info from VOMS) |
| UseEmbeddedBroker | Boolean | The Service can run an embedded ActiveMQ instance ( to be configured only for testing purpose, not suggested for Production environments) |
| DailySummary | Boolean | Specify if the service has to create a daily report containing the messages received for each scope |
| Subscriptions | String | Lists which topic/queue the Consumer has to subscribe to |
| UseEmbeddedDB | Boolean | Specify if the service has to use embedded HSQLDB intead of Mysql |
| DBUser | String | Database User name |
| DBPass | String | Database user password |
A sample JNDI:
      <environment
	name="AccountingDBFile"
	value="accountingdb.file"
	type="java.lang.String"
	override="false" />

      <environment
	name="MonitoringDBFile"
	value="monitoringdb.file"
	type="java.lang.String"
	override="false" />

      <environment
         name="MailRecipients"
         value="recipients.txt"
         type="java.lang.String"
         override="false" />

      <environment
         name="NotifiybyMail"
         value="true"
         type="java.lang.Boolean"
         override="false" />

      <environment
         name="startScopes"
          value="/gcube/devsec"
          type="java.lang.String"
          override="false" />

      <environment
           name="httpServerBasePath"
           value="jetty/webapps"
           type="java.lang.String"
           override="false" />

      <environment
           name="httpServerPort"
           value="6900"
           type="java.lang.String"
           override="false" />

      <environment
         name="monitorRoleString"
         value="Role=VO-Admin"
         type="java.lang.String"
         override="false" />

      <environment
         name="UseEmbeddedBroker"
         value="false"
         type="java.lang.Boolean"
         override="false" />

      <environment
         name="MailSummary"
         value="true"
         type="java.lang.Boolean"
         override="false" />

      <environment
  	 name="UseEmbeddedDB"
	 value="false"
 	 type="java.lang.Boolean"
 	 override="false" />

      <environment
         name="DBUser"
	 value="root"
 	 type="java.lang.String"
 	 override="false" />

      <environment
	 name="DBPass"
	 value=""
 	 type="java.lang.String"
 	 override="false" />
Monitoring Generic Resource
The Messaging Consumer Service configuration for Monitoring ( apart from startup JNDI configuration ) can be dynamically injected using a gCube IS Generic Resource Profile. The Generic resource is retrieved from the IS at service startup and then every 30 min ( IS notification mechanism will be integrated in the next version of the service). Here you can find an example of the Monitoring IS Generic Resource:
<Resource>
    <ID>3a0b4dc0-8e2f-11de-8907-e7af4122e74f</ID>
    <Type>GenericResource</Type>
    <Profile>
        <SecondaryType>MONITORING_CONFIGURATION</SecondaryType>
        <Name>Monitoring configuration</Name>
        <Description>Monitoring configuration for /testing scope</Description>
        <Body>
            <Scope name="/testing">
		<CPULoad>3.0</CPULoad>
		<DiskQuota>1000000</DiskQuota>
		<VirtualMemory>20000000</VirtualMemory>
		<NotificationConfiguration>
		 <Domain name="4dsoft.hu" site="4DSOFT">
			<User email="andrea.manzi@cern.ch" name="andrea"  notify="true" receiveSummary="true" admin="true"/>
			<User email="andor.dirner@4dsoft.hu" name="andor" notify="true" receiveSummary="false" admin="false"/>
		 </Domain>
		 <Domain name="cern.ch" site="CERN" >
			<User email="andrea.manzi@cern.ch" name="andrea" notify="true" receiveSummary="false" admin="true"/>
		 </Domain>
	        </NotificationConfiguration>
            </Scope>
        </Body>
    </Profile>
</Resource>
The resource specifies Monitoring thresholds for:
- CPU LOAD
- DISK QUOTA
- VIRTUAL MEMORY
In addition it specifies the configuration for the Messaging Consumer notifications. In particular each GHN domain is linked to one or more Administrator/Site Manager contacts, that can be configured to receive notification and daily summary.
DB Structure
Two Databases store the Monitoring/Accounting information.
Please check the following links for DB schemas and snapshots ( last updated 16/08/2010 )
Software Dependencies
The Service depends on the following list of Third-party libraries:
- [11]ActiveMQ v 5.2.0
- [12]JMS 1.1.0
- [13]hsqldb v 1.8.0
- [14]jetty v 7.0.0
- [15]javamail v 1.4.0
- [16] MYSQL JDBC v 5.1
Portlets
Portal Accounting portlet
The visualization of the information collected by the Portal Accounting probe, exploiting the Messaging infrastructure, is implemented by a JSR168 compliant GWT 2.4 portlet. The portlet, exploiting the Consumer-Library method to abstract over the Portal Accounting Database, can be used to easily navigate accounting records by selecting one or more filters. In addition it offers the possibility to aggregate statistics, export them as CSV and create simple graphs.
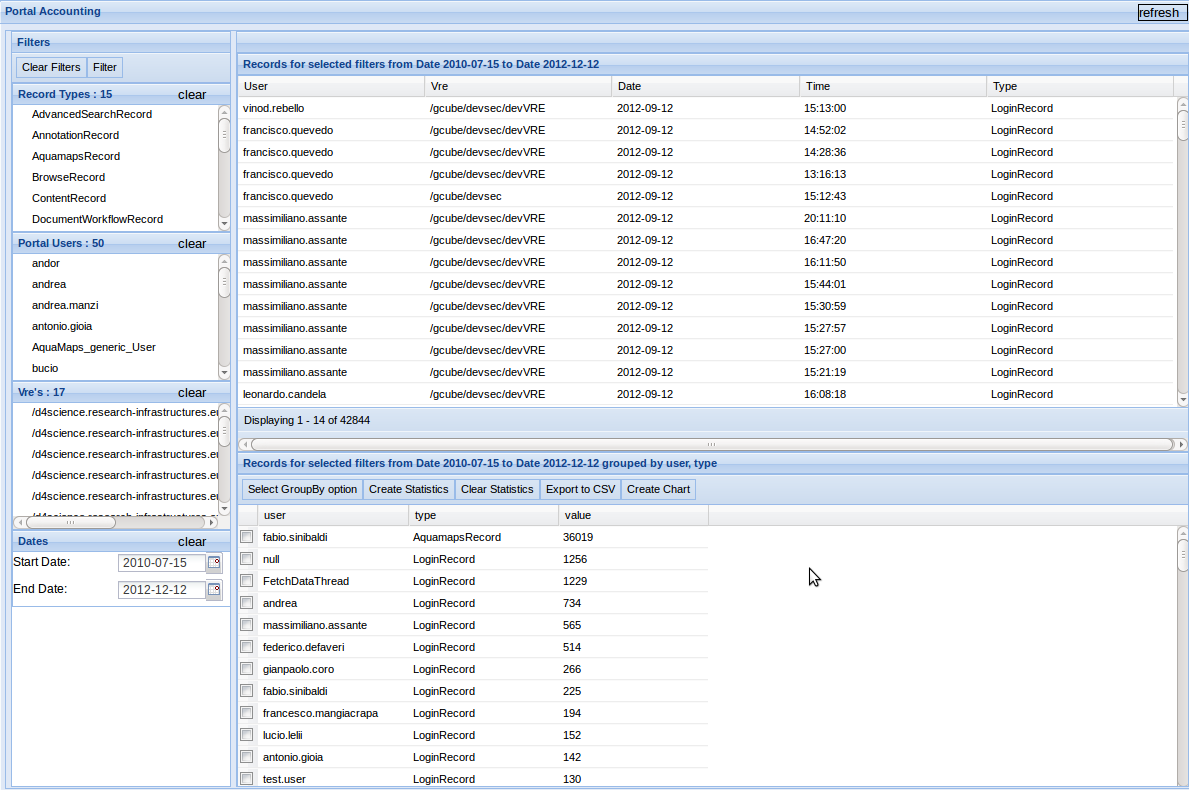
In Detail
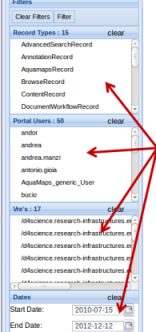
The Filter Panel
It is the panel located on the left side where several filters are provided. The client is able to choose the filter/filters he wants by selecting (single/multi selection) and apply the filter/filters.
It is possible to clear one specific category or all of them.
Provided filter categories are:
record type, user, scope and date.
The Main Grid
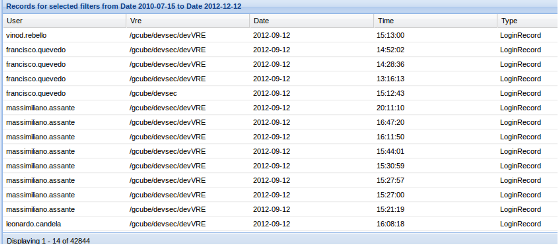
The main grid on the right side contains filtered information. The client by applying the filters he wants is able to show the filtered information in the grid and sort it by a specific column.
The Statistics Grid
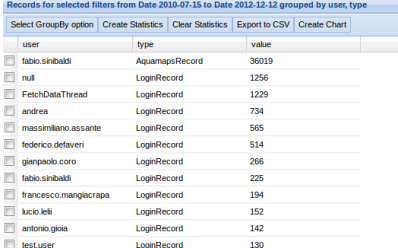
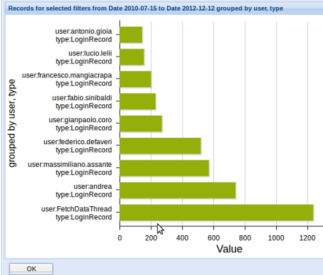
The statistics panel is located on the right-down side and provides both filtered and grouped information. There is the possibility for multiple grouping, showing result, exporting result and making charts with them. Once the client select the grouping options he just clicks on the 'create statistics' button and then he is able to make a chart or export them.
More About Main Grid
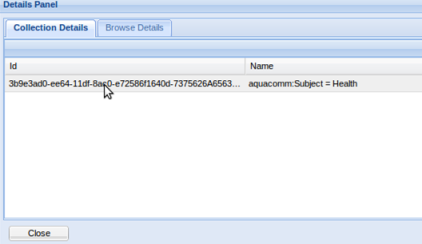
By double clicking on one of the rows a pop up panel is shown with all details information about the specific record.
More About Statistics Grid
For making chart, specific selected records are expected.

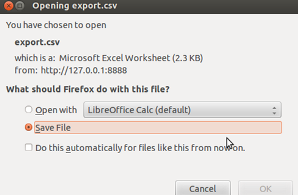
For exporting the result of the statistics just click on the 'export to CSV' and a pop up window will be shown for showing or saving the csv file.
Chart
The information provided in the chart depend on the selected grouping options and the number of records shown.
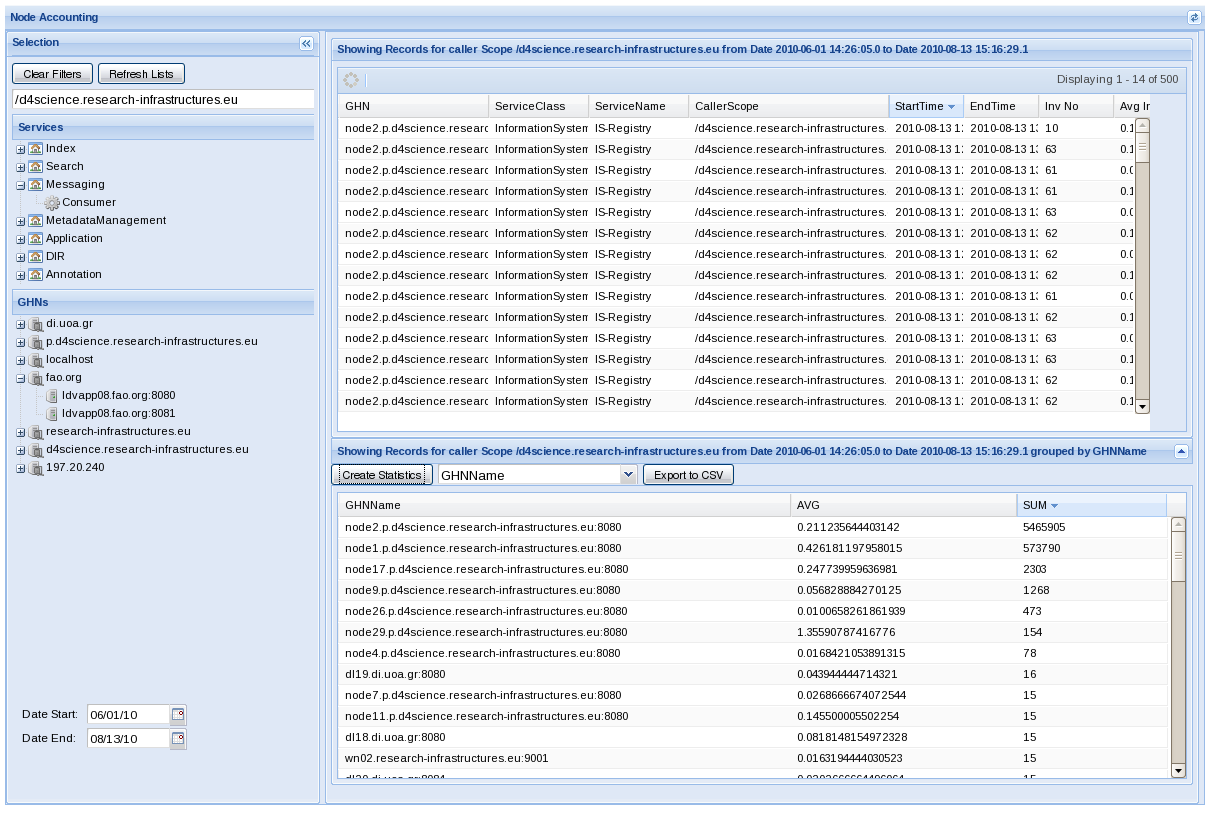
Node Accounting portlet
The visualization of the information collected by the Node Accounting probe is implemented by a JSR168 compliant GWT 2.0 portlet. The portlet, exploiting the Consumer-Library method to abstract over the Node Accounting Database, can be used to easily navigate accounting records by filtering over:
- GHN Name
- Service Class / Name
- Date
- Caller Scope
In addition it offers the possibility to aggregate statistics, export them as CSV and create simple graph.
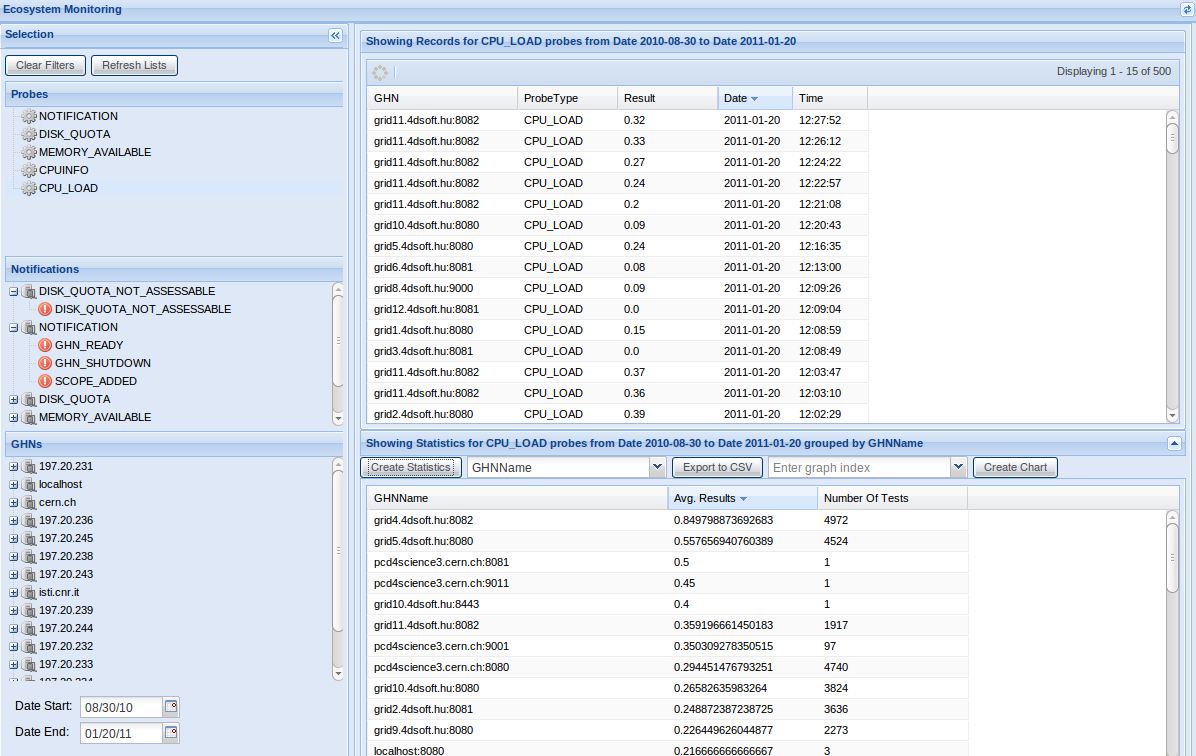
Monitoring portlet
The visualization of the information collected by the monitoring probe, exploiting the Messaging infrastructure, is implemented by a JSR168 compliant GWT 2.0 portlet. The portlet, exploiting the Consumer-Library method to abstract over the Monitoring Database, can be used to easily navigate monitoring records by filtering over:
- probes type
- GHNs
- date
The same portlet shows history about Monitoring notifications sent by the Messaging Consumer to Site Admins. As for Monitoring information they can be filter by :
- notification type
- GHNs
- date
In addition it offers the possibility to aggregate statistics, export them as CSV and create simple graphs.

